Dashboard analytics modern
1344×768 · AVIF · CC BY 4.0
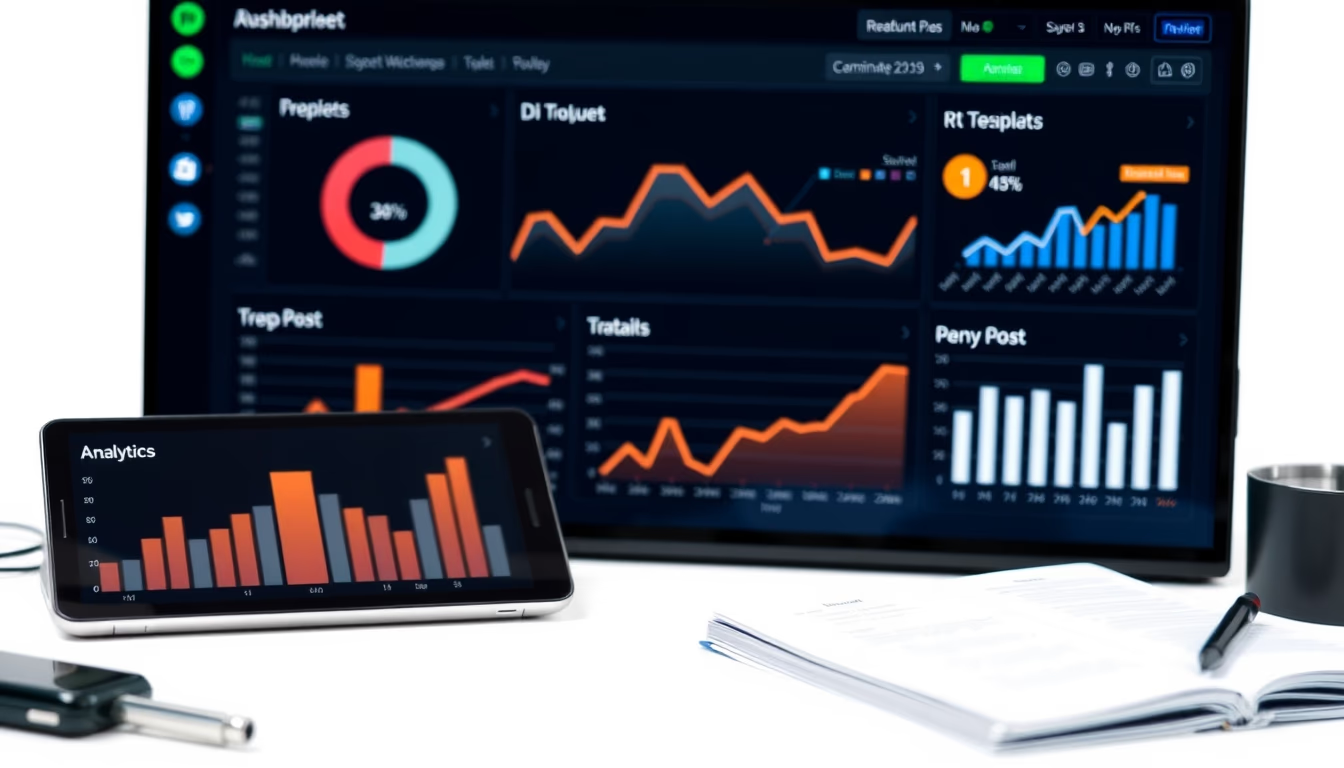
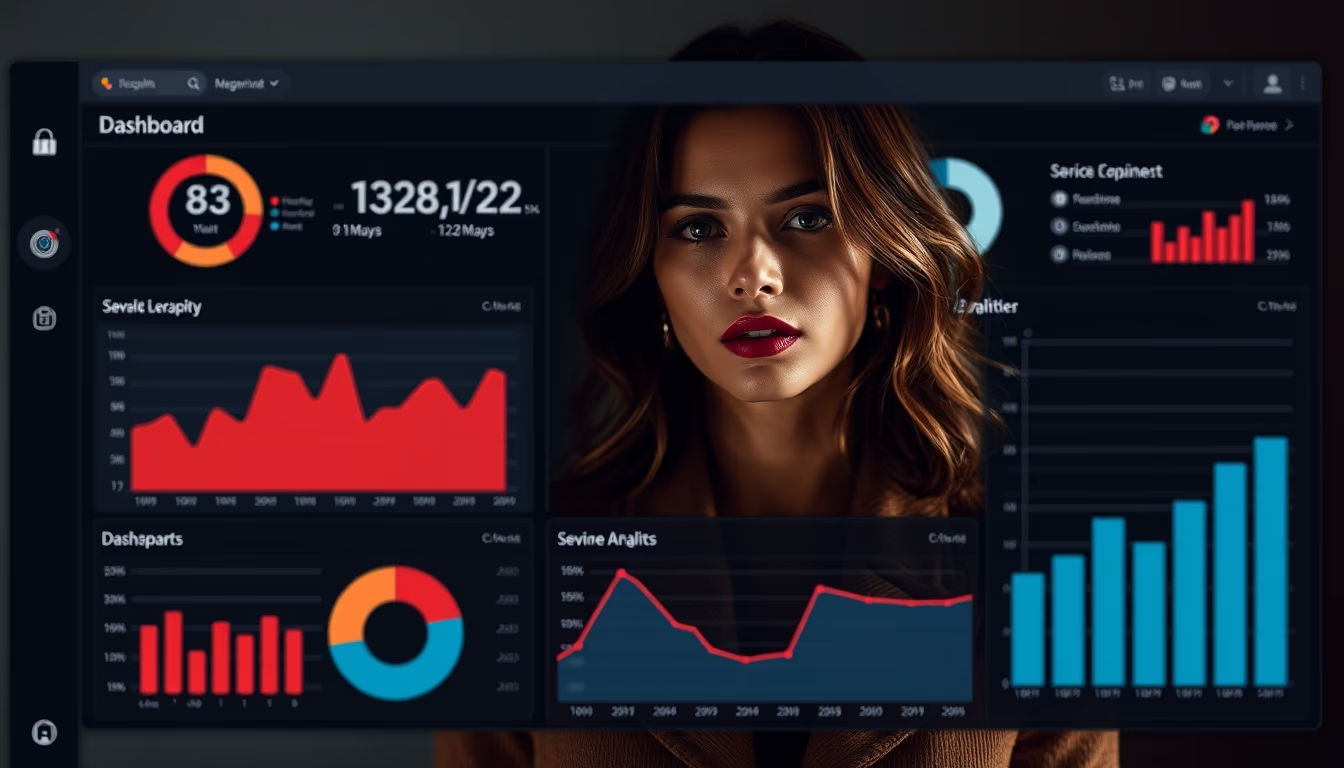
Modern analytics dashboards transform raw data into actionable visual insights, essential for fast, evidence-based business decisions.
About this subject
Modern analytics dashboards are Business Intelligence (BI) tools that consolidate, visualize, and enable interaction with data in real time. They replace static reports with dynamic panels where key metrics such as revenue, engagement, and operational performance are monitored continuously. Globally, the adoption of dashboards has surged with digital transformation, especially in retail, finance, and logistics, where decision-making speed is critical.
A core feature is the ability to integrate multiple data sources, including APIs, SQL databases, and spreadsheets. Tools like Tableau, Power BI, and Google Data Studio have become popular for offering drag-and-drop interfaces and built-in machine learning algorithms for trend forecasting. In enterprise environments, dashboards are used to optimize supply chains, predict seasonal demand, and track customer success indicators like CSAT or NPS.
User experience (UX) is prioritized: interactive charts, real-time filters, and personalized alerts allow analysts and managers to explore data without IT support. Mobility is also a key differentiator, many dashboards are responsive and accessible via smartphone, crucial in regions with high mobile penetration. Data security, GDPR compliance, and anonymization capabilities are mandatory for corporate deployments.
Interesting fact: Gartner studies show that companies using modern analytics dashboards are 30% more likely to achieve financial targets. For example, the Brazilian fintech Nubank uses dashboards to monitor transactions and fraud in real time, ensuring operational efficiency and customer satisfaction. The trend is that, with the rise of AI assistants, these dashboards will become even more predictive, suggesting automatic actions based on historical patterns.
Frequently Asked Questions
What are the main differences between a modern dashboard and a traditional report?
A modern dashboard offers real-time interactivity, automatic data updates, and dynamic visualizations, while traditional reports are static and manual. Additionally, dashboards allow drill-down into metrics, custom filters, and alerts, speeding up analysis.
How to choose the best dashboard tool for my company?
Consider factors like number of users, data sources used, need for machine learning, cost, and scalability. Tools such as Tableau (powerful but pricey), Power BI (integrated with Microsoft ecosystem), or Metabase (open source) cater to different profiles.
Do I need technical skills to use modern dashboards?
Most modern dashboards are designed for business users with drag-and-drop interfaces and setup wizards. However, for complex integrations or advanced customizations, support from a data analyst may be needed.
Direct URL
https://pub-c7d6a6ea828543ac903a74a341ccb2e1.r2.dev/imagens/dashboard-analytics-modern-commercial-product-photography-p2.avifHow to credit
Include a visible link back to UtilizAí. Copy one of the snippets below:
<a href="https://xn--utiliza-eza.com/en/midia/imagens/dashboard-analytics-modern-commercial-product-photography-p2">Dashboard analytics modern</a> by <a href="https://xn--utiliza-eza.com">UtilizAí</a>, licensed under <a href="https://creativecommons.org/licenses/by/4.0/">CC BY 4.0</a>.
[Dashboard analytics modern](https://xn--utiliza-eza.com/en/midia/imagens/dashboard-analytics-modern-commercial-product-photography-p2) by [UtilizAí](https://xn--utiliza-eza.com), CC BY 4.0
License: CC-BY-4.0