Dashboard analytics modern
1344×768 · AVIF · CC BY 4.0
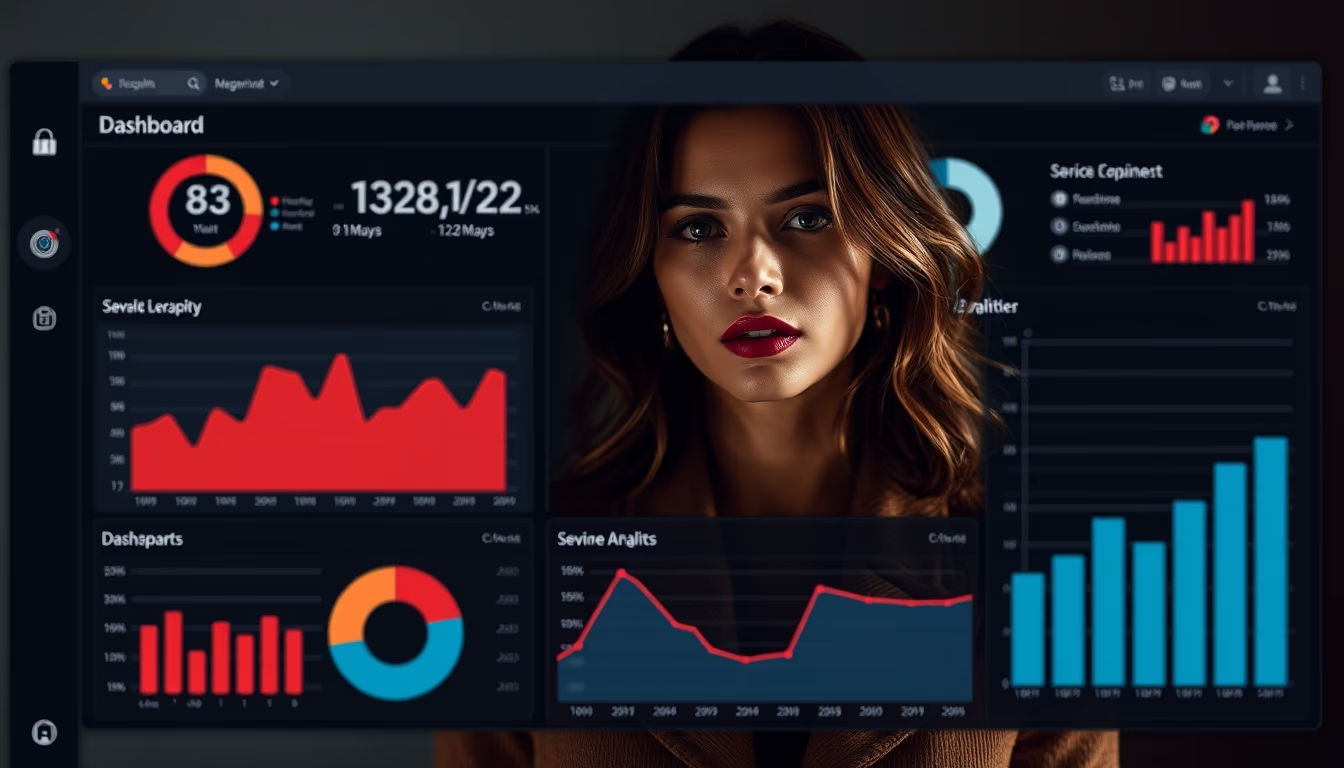
Modern analytics dashboards are essential SaaS tools, combining real-time data visualization with high-impact design.
About this subject
Modern analytics dashboards have evolved from simple bar charts to highly interactive, customizable interfaces. In the SaaS context, these tools are vital for monitoring KPIs such as Monthly Recurring Revenue (MRR), churn rate, Customer Acquisition Cost (CAC), and Lifetime Value (LTV). Companies like Tableau, Power BI, and Looker popularized dashboards that integrate multiple data sources, enabling real-time analysis.
Current trends include the use of artificial intelligence to automatically generate insights, such as anomalies and forecasts. Additionally, the "high-fashion" aesthetic inspires designers to create minimalist visuals with elegant typography and sophisticated color palettes, making data more appealing and easier to interpret. This style is particularly popular among startups aiming to convey modernity and reliability.
In the Brazilian market, the adoption of analytics dashboards has grown significantly, driven by digital transformation and the need for data-driven decisions. Domestic tools like Pipefy and RD Station offer customizable dashboards tailored to local realities. According to Gartner, by 2025, 70% of organizations will use dashboards with data storytelling features.
Interestingly, high-fashion editorial design influences how data is presented: use of negative space, asymmetric grids, and refined visual hierarchy. This approach not only improves usability but also differentiates brands in a competitive market.
Frequently Asked Questions
What is a modern analytics dashboard?
A modern analytics dashboard is a visual interface that consolidates real-time metrics and performance indicators, enabling agile monitoring and decision-making. It stands out for being interactive, customizable, and integrated with multiple data sources.
How do analytics dashboards help SaaS companies?
SaaS companies use dashboards to track critical KPIs like MRR, churn, CAC, and LTV. This allows them to identify trends, quickly detect issues, and optimize growth and retention strategies.
What are current trends in dashboard design?
Current trends include AI-powered automatic insights, data storytelling, minimalist design inspired by high fashion, self-service analytics dashboards, and a strong focus on user experience (UX).
Direct URL
https://pub-c7d6a6ea828543ac903a74a341ccb2e1.r2.dev/imagens/dashboard-analytics-modern-high-fashion-editorial-p5.avifHow to credit
Include a visible link back to UtilizAí. Copy one of the snippets below:
<a href="https://xn--utiliza-eza.com/en/midia/imagens/dashboard-analytics-modern-high-fashion-editorial-p5">Dashboard analytics modern</a> by <a href="https://xn--utiliza-eza.com">UtilizAí</a>, licensed under <a href="https://creativecommons.org/licenses/by/4.0/">CC BY 4.0</a>.
[Dashboard analytics modern](https://xn--utiliza-eza.com/en/midia/imagens/dashboard-analytics-modern-high-fashion-editorial-p5) by [UtilizAí](https://xn--utiliza-eza.com), CC BY 4.0
License: CC-BY-4.0