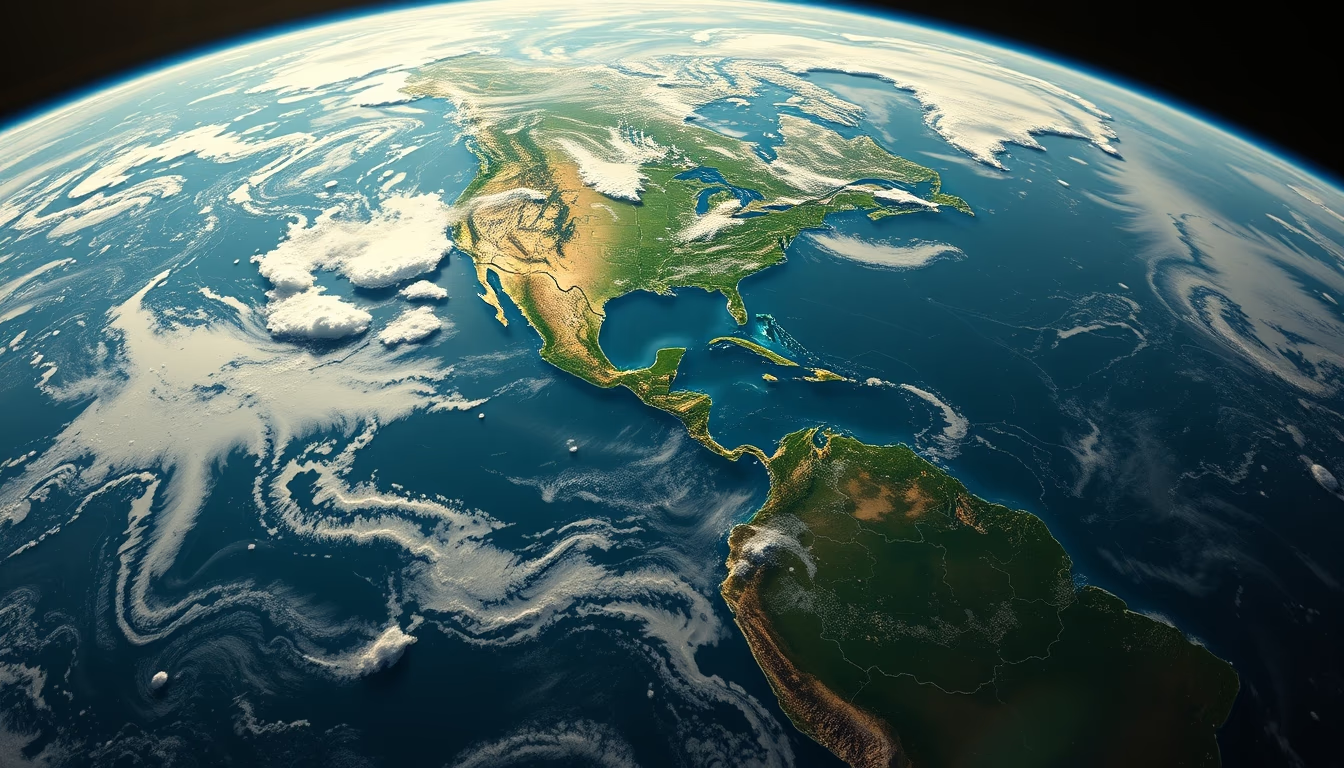
Urban heat island map
1344×768 · AVIF · CC BY 4.0
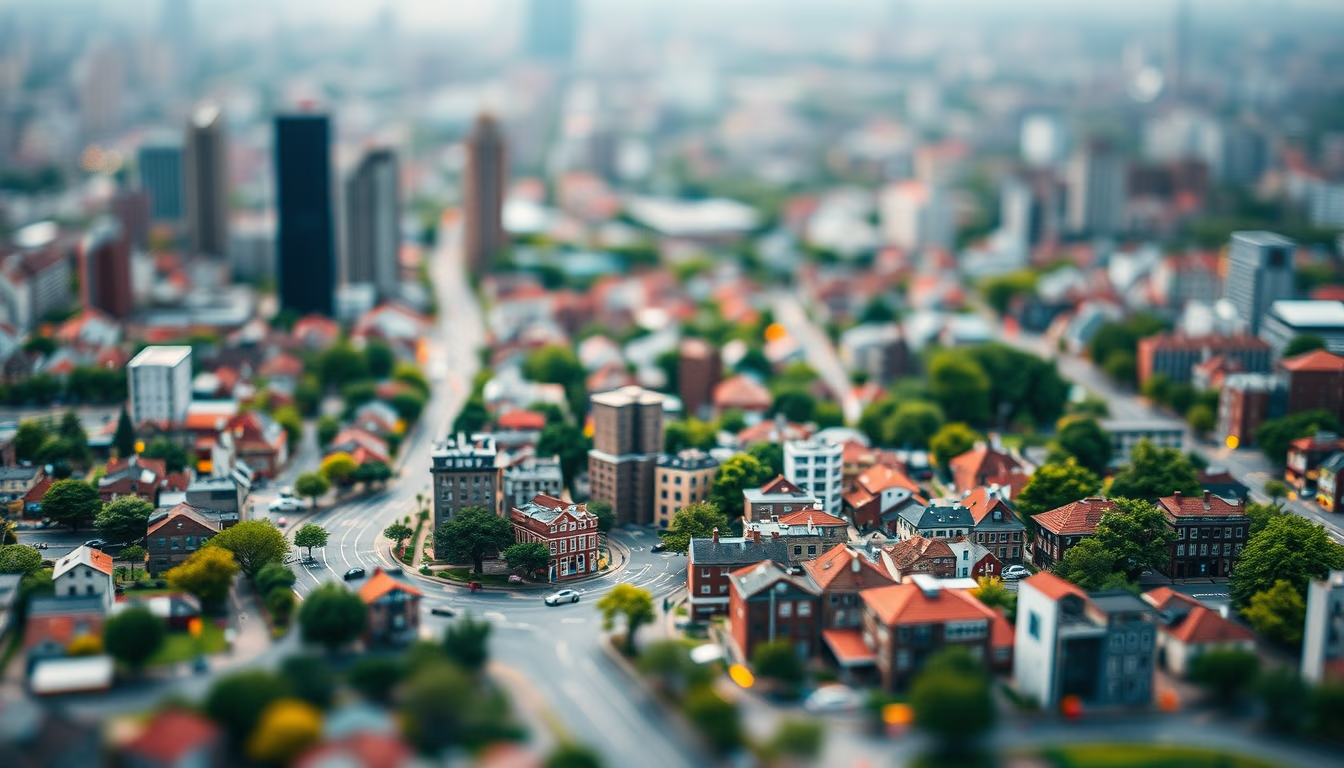
Urban heat island maps are generated by satellites capturing land surface temperatures, revealing thermal differences between built-up areas and green spaces.
About this subject
The urban heat island phenomenon occurs when densely built areas experience higher temperatures than their rural or peri-urban surroundings. This effect is mainly caused by replacing natural surfaces with asphalt, concrete, and dark roofs that absorb and retain heat, along with reduced vegetation and waste heat from vehicles and air conditioning. Satellites such as Landsat and MODIS (aboard Terra and Aqua) provide land surface temperature data with spatial resolution down to 30 meters, enabling detailed heat island maps.
Large Brazilian metropolises like São Paulo, Rio de Janeiro, and Belo Horizonte show marked thermal differences: central and industrial areas can be 4 to 10 °C hotter than nearby parks and forest reserves, such as Serra da Cantareira or Tijuca Forest. These maps are essential for urban planning, helping to identify critical zones that need more green spaces, cool roofs, or permeable pavements. Cities like Curitiba and Niterói already use such data to guide tree-planting and heat mitigation policies.
Beyond thermal comfort, heat islands intensify heat waves and increase energy consumption for cooling, worsening greenhouse gas emissions. Satellites equipped with thermal sensors, like the TIRS sensor on Landsat 8 and 9, allow monitoring of these anomalies over time, correlating them with vegetation indices (NDVI) and soil imperviousness. Data from the Copernicus program (Sentinel-3) also contributes with daily global coverage, though at coarser resolution (1 km). Integrating these maps with climate models helps forecast future urban warming scenarios.
Interestingly, the term “heat island” was first used by meteorologist Gordon Manley in 1958, and today, with the popularity of drones carrying thermal cameras, high-resolution local maps can be produced for neighborhoods or university campuses. In Brazil, the National Institute for Space Research (INPE) and universities such as USP and Unicamp conduct research on the topic, making data openly available to public managers and civil society.
Frequently Asked Questions
How are urban heat islands measured by satellites?
Satellites like Landsat and MODIS capture thermal infrared radiation emitted by the Earth's surface and convert it into temperature. Sensors such as TIRS (Landsat) provide resolutions of 30 to 100 meters, allowing detection of differences between streets, rooftops, and parks.
What is the typical temperature difference between a city center and a green area?
In large Brazilian cities, this difference can range from 4 °C to 10 °C, depending on building density, pavement, and vegetation cover. Well-forested urban parks and forest reserves can act as cool islands within the heat footprint.
What can be done to reduce urban heat islands?
Measures include increasing green spaces with trees and gardens, using cool (reflective) or green roofs, permeable and light-colored pavements, and creating ventilation corridors. Urban planning based on heat maps helps prioritize interventions.
Direct URL
https://pub-c7d6a6ea828543ac903a74a341ccb2e1.r2.dev/imagens/urban-heat-island-map-tilt-shift-miniature-fresh12.avifHow to credit
Include a visible link back to UtilizAí. Copy one of the snippets below:
<a href="https://xn--utiliza-eza.com/en/midia/imagens/urban-heat-island-map-tilt-shift-miniature-fresh12">Urban heat island map</a> by <a href="https://xn--utiliza-eza.com">UtilizAí</a>, licensed under <a href="https://creativecommons.org/licenses/by/4.0/">CC BY 4.0</a>.
[Urban heat island map](https://xn--utiliza-eza.com/en/midia/imagens/urban-heat-island-map-tilt-shift-miniature-fresh12) by [UtilizAí](https://xn--utiliza-eza.com), CC BY 4.0
License: CC-BY-4.0