Urban heat island map
1344×768 · AVIF · CC BY 4.0
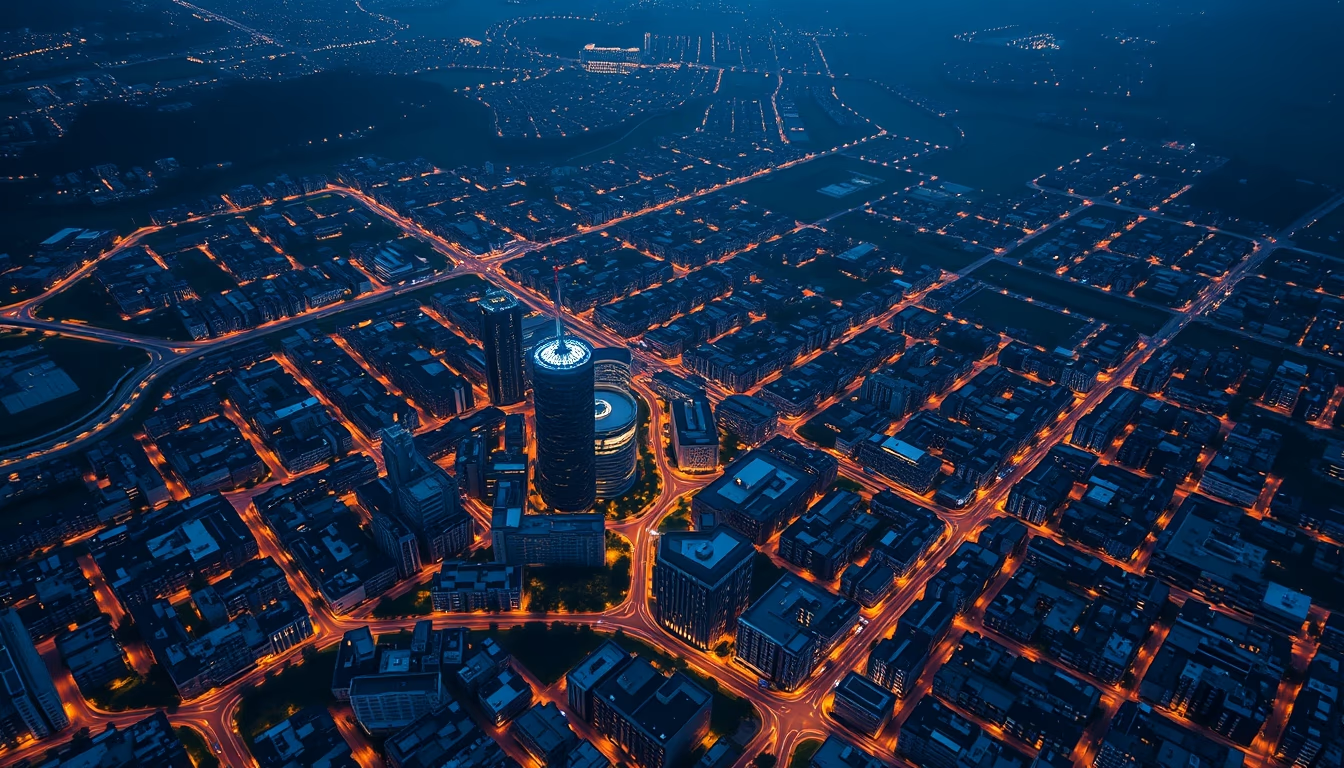
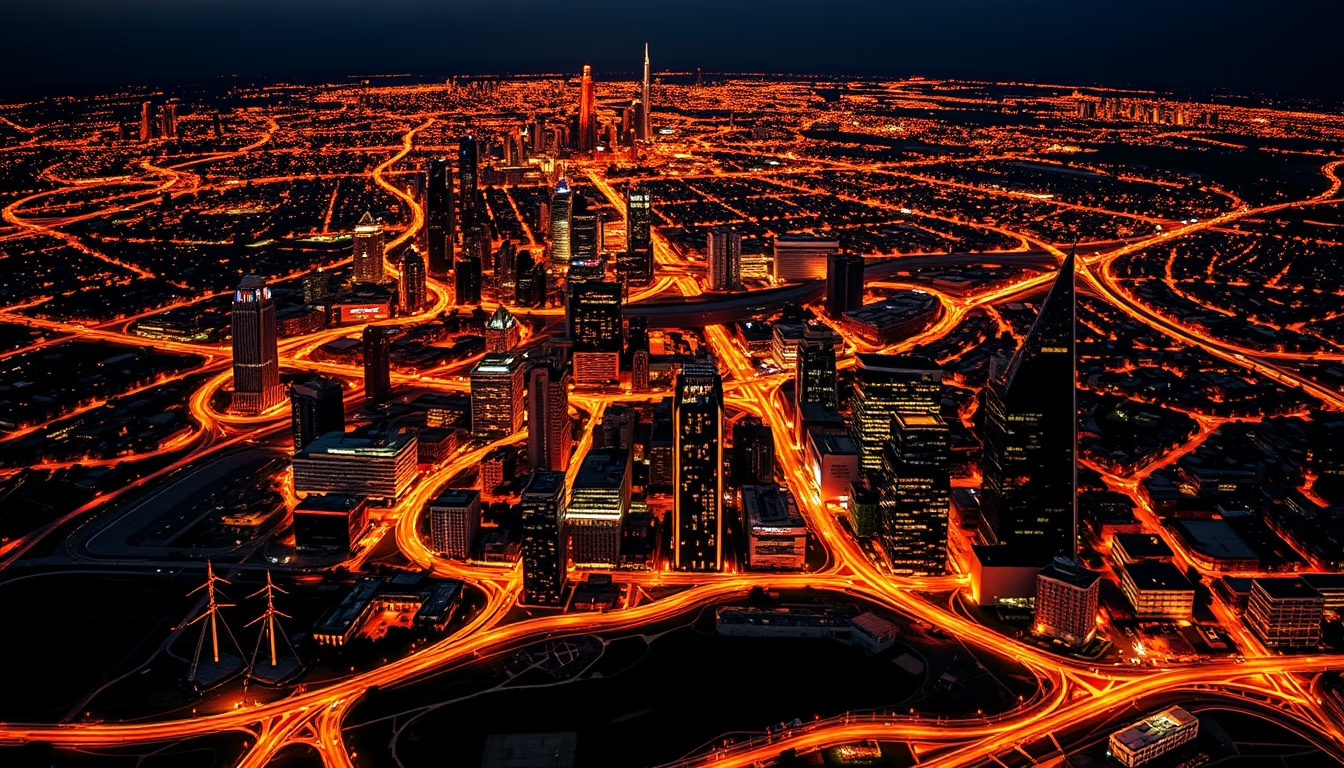
Urban heat island maps reveal extreme temperature differences between city centers and outskirts, directly impacting health and energy consumption.
About this subject
Urban heat islands (UHIs) are climatic phenomena where metropolitan areas experience significantly higher temperatures than surrounding rural zones. This effect is primarily caused by the replacement of natural surfaces with asphalt, concrete, and dark roofs that absorb and retain heat, along with reduced vegetation and heat emissions from vehicles and air conditioning systems. UHI maps, generated by satellites like Landsat or airborne sensors, use thermal bands to measure land surface temperature, creating heat gradients that guide urban planning policies.
Cities such as São Paulo and Rio de Janeiro record differences of up to 10°C between densely built neighborhoods and wooded parks. Tokyo, for example, has documented an average increase of 3°C to 5°C in its core since 1900. These maps are crucial for identifying areas vulnerable to heat waves, which disproportionately affect low-income populations with less access to green spaces or air conditioning. NASA studies indicate that in 2023, 70% of major global cities experienced at least one heat wave intensified by the urban heat island effect.
Solutions based on these maps include installing cool roofs (reflective), permeable pavements, and planting trees in priority corridors. Cities like Seoul and Melbourne have adopted thermal zoning that requires minimum vegetation cover in new developments. In Brazil, Belo Horizonte uses satellite data to create urban cooling zones in high-risk areas. Map accuracy depends on spatial resolution and capture time, with nighttime images being more representative of heat storage throughout the day.
Frequently Asked Questions
What causes urban heat islands?
Urban heat islands are caused by replacing vegetation with impervious, dark surfaces (asphalt, concrete, roofs) that absorb more solar radiation, along with heat from human activities like traffic and air conditioning.
How are urban heat island maps created?
They are generated using thermal infrared sensors on satellites (e.g., Landsat, MODIS) or drones that measure land surface temperature. The data is processed into color gradients highlighting the hottest areas.
What can be done to mitigate the urban heat island effect?
Measures include increasing vegetation (trees, green roofs), using reflective or permeable pavements, promoting cool roofs, and planning urban ventilation corridors.
Direct URL
https://pub-c7d6a6ea828543ac903a74a341ccb2e1.r2.dev/imagens/urban-heat-island-map-aerial-drone-shot-fresh17.avifHow to credit
Include a visible link back to UtilizAí. Copy one of the snippets below:
<a href="https://xn--utiliza-eza.com/en/midia/imagens/urban-heat-island-map-aerial-drone-shot-fresh17">Urban heat island map</a> by <a href="https://xn--utiliza-eza.com">UtilizAí</a>, licensed under <a href="https://creativecommons.org/licenses/by/4.0/">CC BY 4.0</a>.
[Urban heat island map](https://xn--utiliza-eza.com/en/midia/imagens/urban-heat-island-map-aerial-drone-shot-fresh17) by [UtilizAí](https://xn--utiliza-eza.com), CC BY 4.0
License: CC-BY-4.0