Investment portfolio chart hologram
1344×768 · AVIF · CC BY 4.0
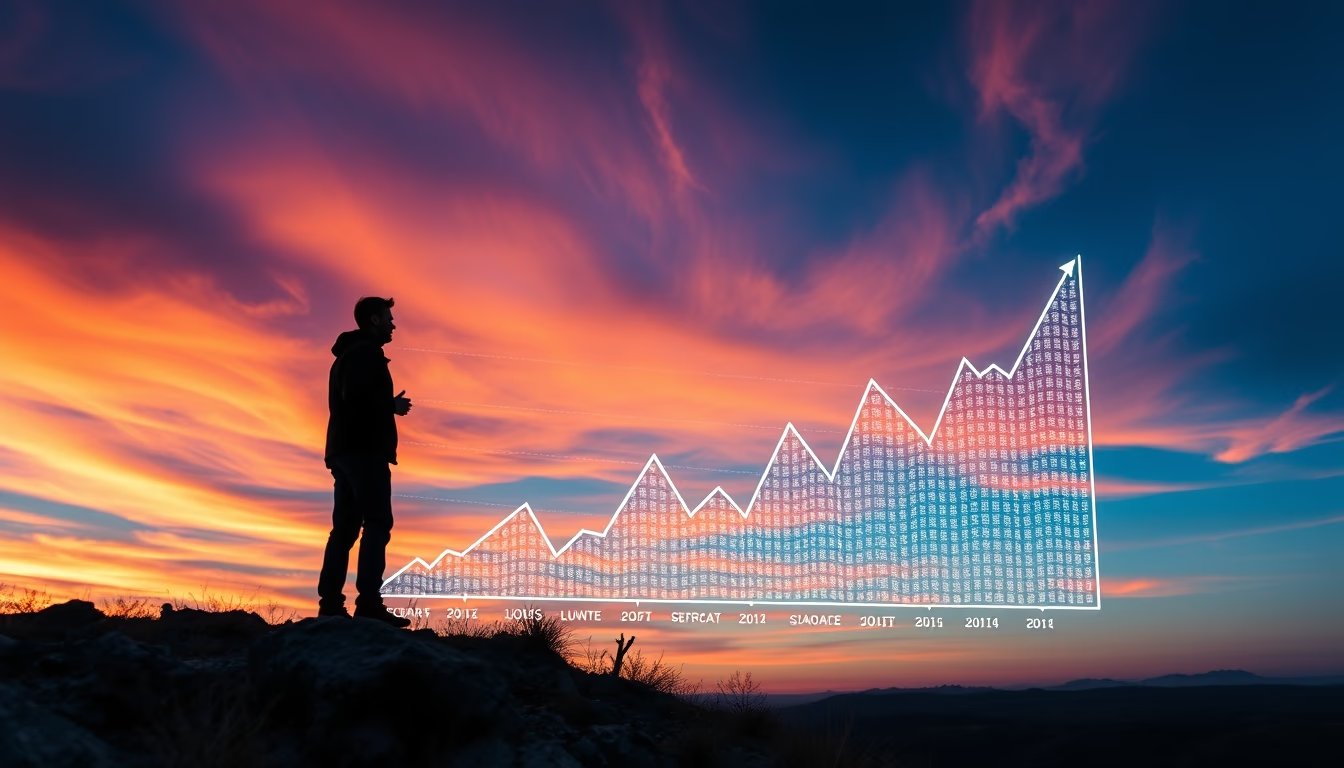
A hologram of an investment portfolio chart projects financial data in three dimensions, revolutionizing market analysis.
About this subject
Holograms of investment portfolio charts represent an innovation in financial data visualization, allowing analysts and investors to interact with complex information intuitively. Unlike traditional two-dimensional charts, these three-dimensional projections facilitate the identification of trends, correlations, and anomalies in real time. Companies like Microsoft and Google have invested in mixed reality technologies that integrate holograms into financial dashboards, such as Microsoft HoloLens applied to capital markets.
Holographic technology applied to finance emerged from the need to process growing volumes of data. With the popularization of big data and machine learning, holograms allow multiple variables to be presented simultaneously, such as volatility, historical return, and sector allocation. Institutions like the New York Stock Exchange have already tested holographic systems to monitor indices in real time.
In Brazil, the use of holograms in finance is still incipient, but startups like Holograf have developed solutions for portfolio visualization. The technology relies on depth sensors and advanced graphics processing, such as those found in Magic Leap or HoloLens 2. Experts predict that by 2030, interactive holograms will be common in trading rooms and investment meetings.
Interestingly, holography was invented in 1947 by Hungarian physicist Dennis Gabor, who won the Nobel Prize in Physics in 1971. Initially used in microscopy, the technique evolved into commercial applications with the advent of lasers. Today, financial data holograms combine optics, computer graphics, and artificial intelligence, representing the convergence of technology and capital markets.
Frequently Asked Questions
How does a portfolio chart hologram work?
A portfolio chart hologram uses coherent light (laser) to project a three-dimensional image that can be viewed without special glasses. Motion sensors allow interaction with the data, such as rotating or zooming the chart.
Which companies are developing this technology?
Companies like Microsoft (with HoloLens), Magic Leap, and startups like Holograf are at the forefront. In the financial sector, banks such as JPMorgan and Goldman Sachs have tested prototypes.
Are investment holograms safe for sensitive data?
Yes, holographic systems can be integrated with secure networks and end-to-end encryption. The projection is local, with no data transmitted over the internet, reducing interception risks.
Direct URL
https://pub-c7d6a6ea828543ac903a74a341ccb2e1.r2.dev/imagens/investment-portfolio-chart-hologram-landscape-photography.avifHow to credit
Include a visible link back to UtilizAí. Copy one of the snippets below:
<a href="https://xn--utiliza-eza.com/en/midia/imagens/investment-portfolio-chart-hologram-landscape-photography">Investment portfolio chart hologram</a> by <a href="https://xn--utiliza-eza.com">UtilizAí</a>, licensed under <a href="https://creativecommons.org/licenses/by/4.0/">CC BY 4.0</a>.
[Investment portfolio chart hologram](https://xn--utiliza-eza.com/en/midia/imagens/investment-portfolio-chart-hologram-landscape-photography) by [UtilizAí](https://xn--utiliza-eza.com), CC BY 4.0
License: CC-BY-4.0





