Dashboard de investimentos com gráfico de portfolio
1344×768 · AVIF · CC BY 4.0
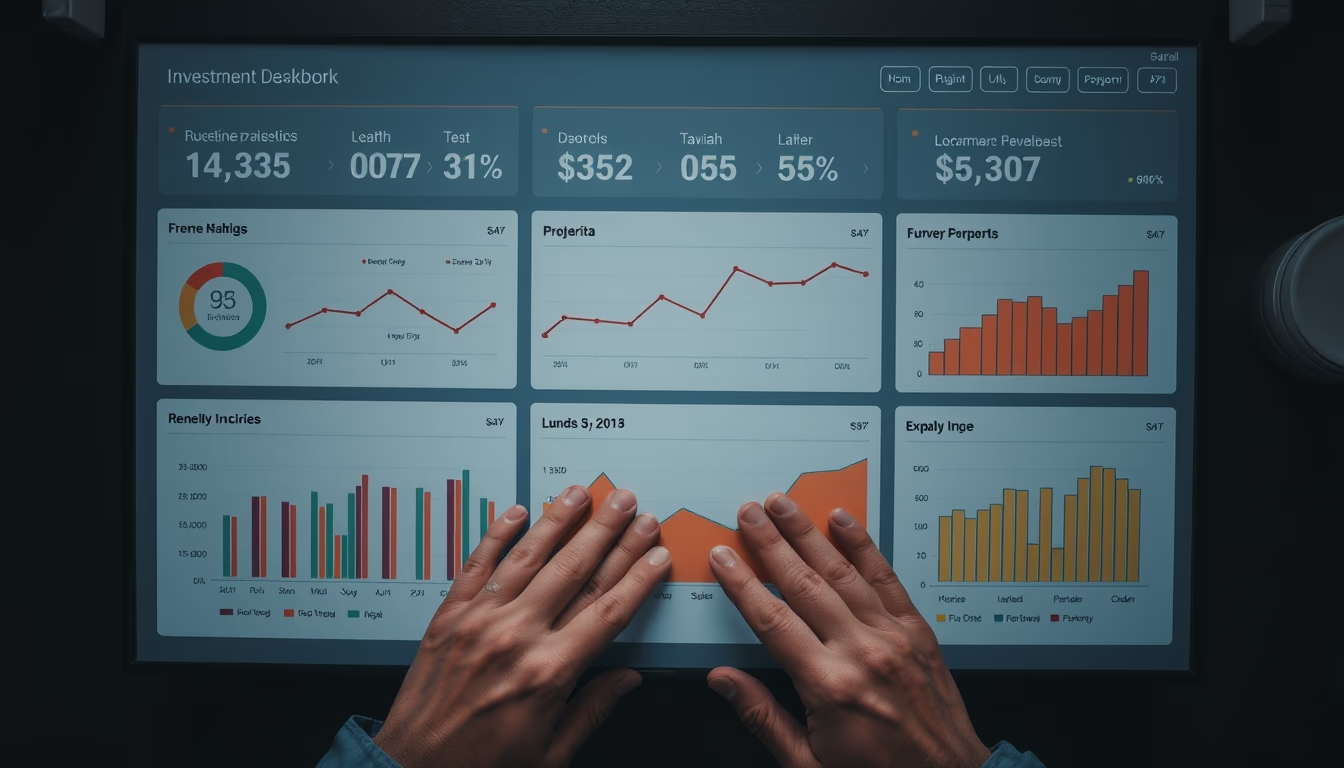
Dashboard de investimentos com gráfico de portfólio mostra alocação de ativos em tempo real, ferramenta essencial para gestão financeira pessoal e profissional.
Sobre o tema
Dashboards de investimentos são painéis interativos que consolidam informações financeiras em uma única tela, permitindo monitorar o desempenho de ativos como ações, títulos, fundos imobiliários e criptomoedas. O gráfico de portfólio, geralmente em formato de pizza ou barras empilhadas, detalha a distribuição percentual de cada classe de ativo, ajudando investidores a manterem a estratégia de alocação desejada.
No Brasil, o uso de dashboards cresceu com a popularização das fintechs e corretoras digitais. Ferramentas como o Resgate Fácil da XP Investimentos ou o TradeMap permitem que investidores pessoa física acompanhem suas carteiras em tempo real, algo que antes era restrito a gestores profissionais. A visualização gráfica facilita a identificação de desbalanceamentos, como excesso de exposição a um setor ou falta de diversificação.
Curiosamente, estudos mostram que investidores que revisam seus portfólios com frequência tendem a tomar decisões mais emocionais, enquanto aqueles que usam dashboards com alertas automáticos conseguem manter a disciplina. Por isso, muitos sistemas incorporam métricas como volatilidade, retorno acumulado e correlação entre ativos. A imagem, com iluminação profissional e ângulo aéreo, simula um ambiente de alta tecnologia, comum em salas de trading ou escritórios de wealth management.
Perguntas frequentes
O que é um dashboard de investimentos?
É uma ferramenta visual que consolida dados financeiros, como saldos, rentabilidade e alocação de ativos, em gráficos e tabelas interativas para facilitar a tomada de decisão.
Como interpretar um gráfico de portfólio?
O gráfico mostra a porcentagem de cada ativo ou classe na carteira. Uma boa prática é comparar com a alocação-alvo definida no planejamento financeiro.
Quais são os melhores dashboards de investimento no Brasil?
Ferramentas como TradeMap, Resgate Fácil (XP), e o app do BTG Pactual são populares. Para análise avançada, muitos usam o Excel ou plataformas como o MetaTrader.
URL direta
https://pub-c7d6a6ea828543ac903a74a341ccb2e1.r2.dev/imagens/investment-dashboard-with-portfolio-breakdown-chart-aerial-drone-shot-studio-professional-lighting.avifComo creditar
Inclua um link visível de volta pro UtilizAí. Copie um dos snippets abaixo:
<a href="https://xn--utiliza-eza.com/midia/imagens/investment-dashboard-with-portfolio-breakdown-chart-aerial-drone-shot-studio-professional-lighting">Dashboard de investimentos com gráfico de portfolio</a> by <a href="https://xn--utiliza-eza.com">UtilizAí</a>, licensed under <a href="https://creativecommons.org/licenses/by/4.0/">CC BY 4.0</a>.
[Dashboard de investimentos com gráfico de portfolio](https://xn--utiliza-eza.com/midia/imagens/investment-dashboard-with-portfolio-breakdown-chart-aerial-drone-shot-studio-professional-lighting) by [UtilizAí](https://xn--utiliza-eza.com), CC BY 4.0
Licença: CC-BY-4.0





