Forex trading screen multiple charts
1344×768 · AVIF · CC BY 4.0
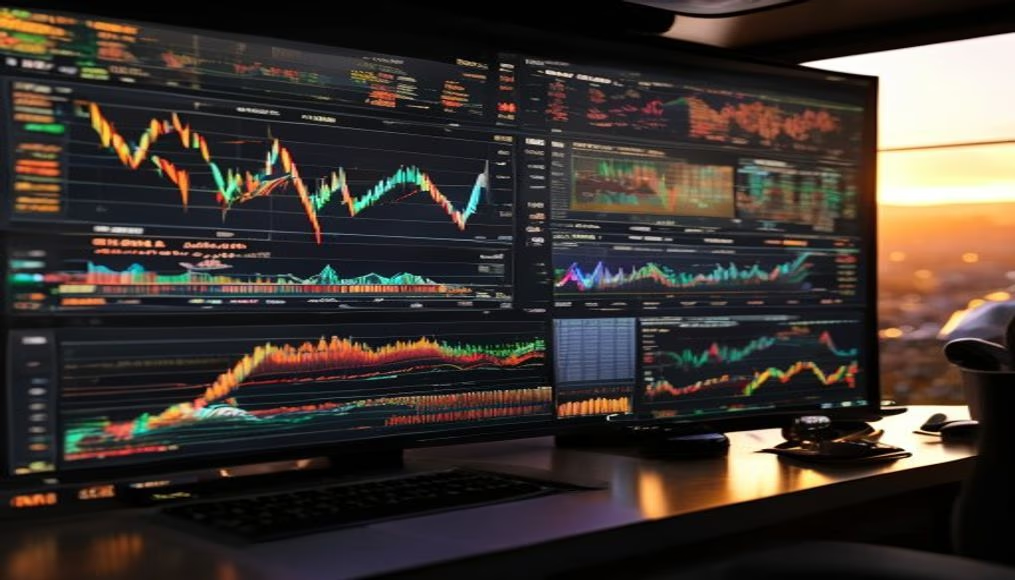
Multiple charts on a forex trading screen display technical analysis of currency pairs, indicators, and real-time market trends.
About this subject
The forex market, or foreign exchange, is the largest and most liquid financial market globally, with a daily turnover exceeding 6 trillion dollars. Traders use platforms with multiple charts to monitor several currency pairs simultaneously, such as EUR/USD, GBP/JPY, and USD/BRL. Each chart can display candlesticks, trendlines, moving averages, RSI, MACD, and other essential technical indicators for buy and sell decisions.
Technical analysis is the foundation of short-term trading, and arranging multiple charts allows comparing correlations between assets. For instance, gold (XAU/USD) often moves inversely to the US dollar, and a trader can observe this in real time. Additionally, tools like Fibonacci retracements and support/resistance levels are drawn directly on charts. Platforms such as MetaTrader 4 and 5, cTrader, and TradingView offer customizable layouts with up to 20 windows.
In Brazil, the forex market is regulated by the CVM and operated through international brokers. Many Brazilian traders combine chart analysis with economic news, like COPOM decisions and US employment data. Using multiple charts reduces the risk of missing important moves but requires discipline and technical knowledge. Common mistakes include indicator overload and lack of a trading plan.
Fun fact: The term 'forex' comes from 'foreign exchange'. Unlike stock exchanges, forex operates 24 hours a day from Monday to Friday due to time zones of financial centers: Tokyo, London, and New York. The multiple-chart screen reflects the agility needed to operate in this dynamic environment, where every second can mean profit or loss.
Frequently Asked Questions
How many charts should I use simultaneously in forex?
There is no fixed number, but 4 to 6 charts is recommended to avoid visual overload. Beginners can start with 2 or 3 major currency pairs.
Which technical indicators are essential for multiple charts?
Moving averages (e.g., EMA 20 and 50), RSI, MACD, and Bollinger Bands are the most common. Each trader chooses combinations based on their strategy.
How to organize multiple charts on the screen?
Most platforms allow dragging windows and saving layouts. A good practice is to place charts of different timeframes (e.g., 15 min and 1 hour) side by side to see short- and medium-term trends.
Direct URL
https://pub-c7d6a6ea828543ac903a74a341ccb2e1.r2.dev/imagens/forex-trading-screen-multiple-charts-travel-photography-v10.avifHow to credit
Include a visible link back to UtilizAí. Copy one of the snippets below:
<a href="https://xn--utiliza-eza.com/en/midia/imagens/forex-trading-screen-multiple-charts-travel-photography-v10">Forex trading screen multiple charts</a> by <a href="https://xn--utiliza-eza.com">UtilizAí</a>, licensed under <a href="https://creativecommons.org/licenses/by/4.0/">CC BY 4.0</a>.
[Forex trading screen multiple charts](https://xn--utiliza-eza.com/en/midia/imagens/forex-trading-screen-multiple-charts-travel-photography-v10) by [UtilizAí](https://xn--utiliza-eza.com), CC BY 4.0
License: CC-BY-4.0





