Forex trading screen multiple charts
1344×768 · AVIF · CC BY 4.0
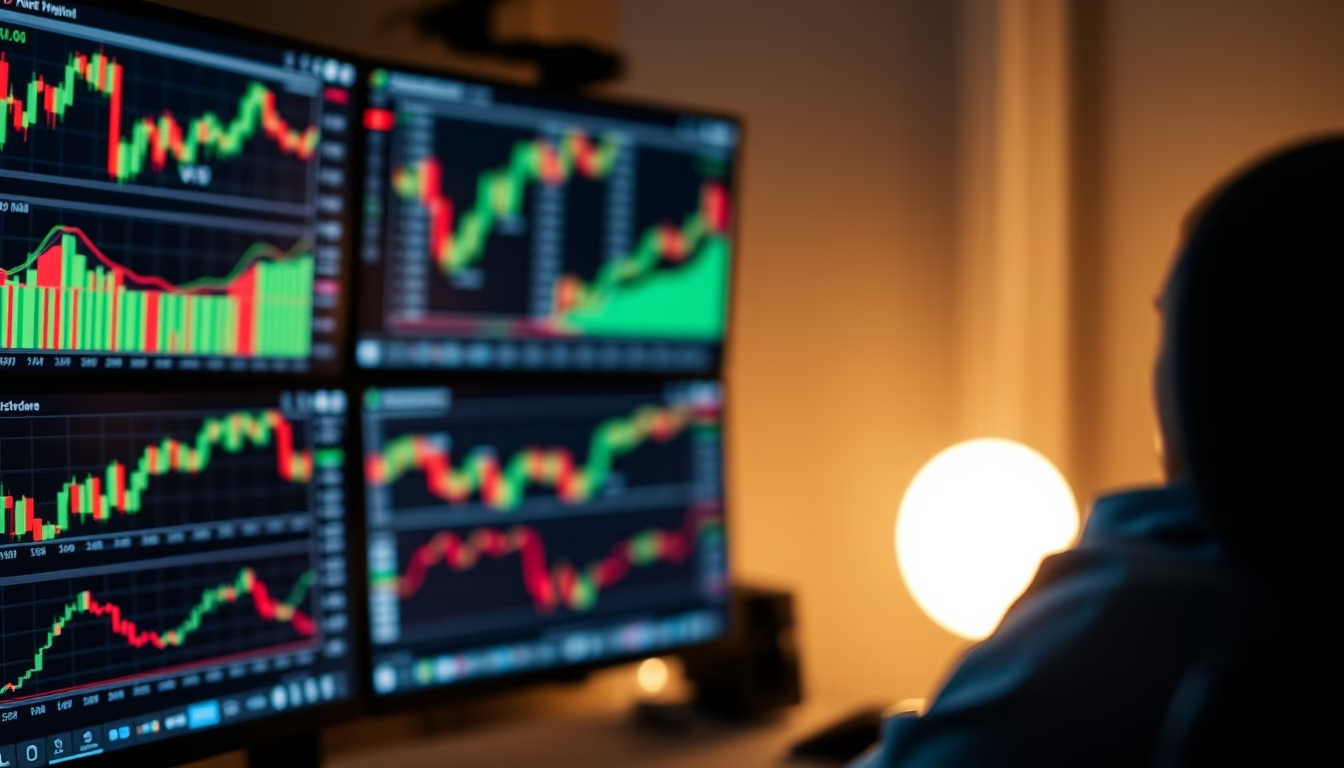
Forex trading screen with multiple charts displaying real-time technical analysis of currency pairs such as EUR/USD and GBP/JPY.
About this subject
The foreign exchange market, known as forex, is the largest and most liquid financial market in the world, with a daily trading volume exceeding 6 trillion dollars. Unlike stock exchanges, forex operates 24 hours a day, five days a week, following the time zones of major financial centers: London, New York, Tokyo, and Sydney. Traders use platforms such as MetaTrader 4 or 5, which allow customized layouts with multiple simultaneous charts, each representing a different currency pair, like EUR/USD, GBP/JPY, USD/JPY, and AUD/USD.
Technical analysis is the primary tool for forex traders. It relies on studying price charts using indicators such as moving averages, Bollinger Bands, RSI (Relative Strength Index), and MACD (Moving Average Convergence Divergence). Each chart can be set to different timeframes, from minutes to months, helping identify short-term and long-term trends. Combining multiple charts on a single screen allows traders to monitor several pairs simultaneously and make quick decisions based on patterns like support and resistance, candlesticks, and chart formations.
Forex attracts both institutional and retail investors due to the high leverage offered by brokers, which can reach 50:1 or more. However, this leverage also increases risks. The market is influenced by macroeconomic factors such as interest rates, inflation, GDP, and geopolitical events. For example, decisions by the Federal Reserve (Fed) on US interest rates directly impact the dollar and consequently all pairs involving it. Experienced traders often keep a trading journal and use stop-loss orders to manage risk.
A curiosity: the term "forex" is a contraction of "foreign exchange." The modern market began to take shape after the collapse of the Bretton Woods agreement in 1971, when currencies started floating freely. Since then, technology has transformed trading, which was once restricted to banks and large institutions, now accessible to anyone with a smartphone and an internet connection. The image of a screen with multiple charts symbolizes the complexity and agility required in this dynamic environment.
Frequently Asked Questions
What is forex trading?
Forex trading is the buying and selling of foreign currencies in the foreign exchange market, aiming to profit from changes in exchange rates between currency pairs such as EUR/USD or USD/JPY.
What are the major currency pairs traded?
Major pairs include EUR/USD, USD/JPY, GBP/USD, USD/CHF, AUD/USD, USD/CAD, and NZD/USD. They represent the strongest economies and have the highest liquidity.
How does technical analysis work in forex?
Technical analysis studies past price charts to predict future movements. It uses indicators like moving averages, RSI, and Bollinger Bands, along with candlestick patterns and support/resistance levels.
Direct URL
https://pub-c7d6a6ea828543ac903a74a341ccb2e1.r2.dev/imagens/forex-trading-screen-multiple-charts-studio-editorial-portrait-v3.avifHow to credit
Include a visible link back to UtilizAí. Copy one of the snippets below:
<a href="https://xn--utiliza-eza.com/en/midia/imagens/forex-trading-screen-multiple-charts-studio-editorial-portrait-v3">Forex trading screen multiple charts</a> by <a href="https://xn--utiliza-eza.com">UtilizAí</a>, licensed under <a href="https://creativecommons.org/licenses/by/4.0/">CC BY 4.0</a>.
[Forex trading screen multiple charts](https://xn--utiliza-eza.com/en/midia/imagens/forex-trading-screen-multiple-charts-studio-editorial-portrait-v3) by [UtilizAí](https://xn--utiliza-eza.com), CC BY 4.0
License: CC-BY-4.0





