Investment dashboard with portfolio breakdown chart
1344×768 · AVIF · CC BY 4.0
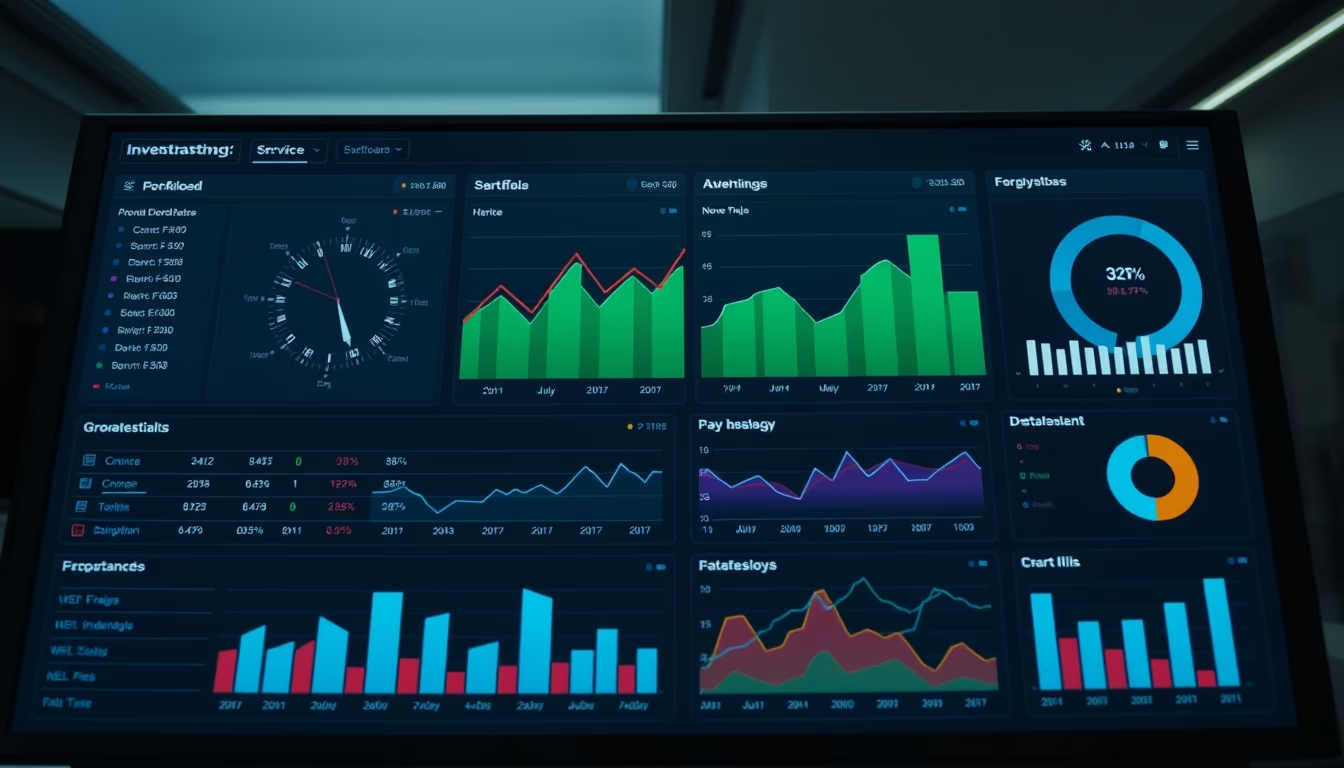
Investment dashboard with portfolio breakdown chart displays real-time asset allocation, an essential tool for personal and institutional financial management.
About this subject
An investment dashboard is an interface that consolidates financial data from multiple sources into a single screen, allowing investors to monitor their asset performance centrally. The portfolio breakdown chart, typically displayed as a pie chart or stacked bar chart, shows the proportion of each asset class (stocks, fixed income, real estate funds, etc.) within the total portfolio. This visualization is crucial for maintaining strategic allocation according to the investor's risk profile, facilitating periodic rebalancing.
In the financial market, such tools are widely used by fund managers, investment advisors, and individual investors seeking to optimize risk-adjusted returns. The technology behind these dashboards involves API integration with brokers and banks, real-time asset price updates, and calculations of metrics like volatility, Sharpe ratio, and maximum drawdown. In Brazil, platforms like Rico, Clear, and BTG Pactual offer similar dashboards, while globally companies like Bloomberg, Morningstar, and Yahoo Finance dominate the segment.
An interesting aspect is the evolution of dashboards: once restricted to expensive terminals at financial institutions, they are now available on free mobile apps, democratizing access to information. The COVID-19 pandemic accelerated the adoption of these tools, with a 40% increase in digital investment platform usage in Brazil between 2020 and 2022. Additionally, artificial intelligence is being incorporated to generate personalized rebalancing alerts and detect portfolio anomalies.
For beginner investors, the dashboard helps understand concepts like diversification and asset correlation. For professionals, it is a key piece in preparing performance reports for clients. Data accuracy is vital: feeding errors can lead to misguided decisions. Therefore, most systems use official sources like B3 in Brazil or the SEC in the United States.
Frequently Asked Questions
What is an investment dashboard?
It is an interface that consolidates financial data from multiple sources into a single screen, displaying charts and indicators to monitor asset performance.
How does portfolio rebalancing work?
Rebalancing adjusts asset allocation to maintain the original strategy, selling assets that exceeded the desired weight and buying those that are below.
What metrics are common in investment dashboards?
Metrics such as volatility, Sharpe ratio, maximum drawdown, and cumulative return are frequently displayed to assess risk and performance.
Direct URL
https://pub-c7d6a6ea828543ac903a74a341ccb2e1.r2.dev/imagens/investment-dashboard-with-portfolio-breakdown-chart-cinematic-wide-shot-overcast-soft-daylight.avifHow to credit
Include a visible link back to UtilizAí. Copy one of the snippets below:
<a href="https://xn--utiliza-eza.com/en/midia/imagens/investment-dashboard-with-portfolio-breakdown-chart-cinematic-wide-shot-overcast-soft-daylight">Investment dashboard with portfolio breakdown chart</a> by <a href="https://xn--utiliza-eza.com">UtilizAí</a>, licensed under <a href="https://creativecommons.org/licenses/by/4.0/">CC BY 4.0</a>.
[Investment dashboard with portfolio breakdown chart](https://xn--utiliza-eza.com/en/midia/imagens/investment-dashboard-with-portfolio-breakdown-chart-cinematic-wide-shot-overcast-soft-daylight) by [UtilizAí](https://xn--utiliza-eza.com), CC BY 4.0
License: CC-BY-4.0





