Forex trading screen multiple charts
1344×768 · AVIF · CC BY 4.0
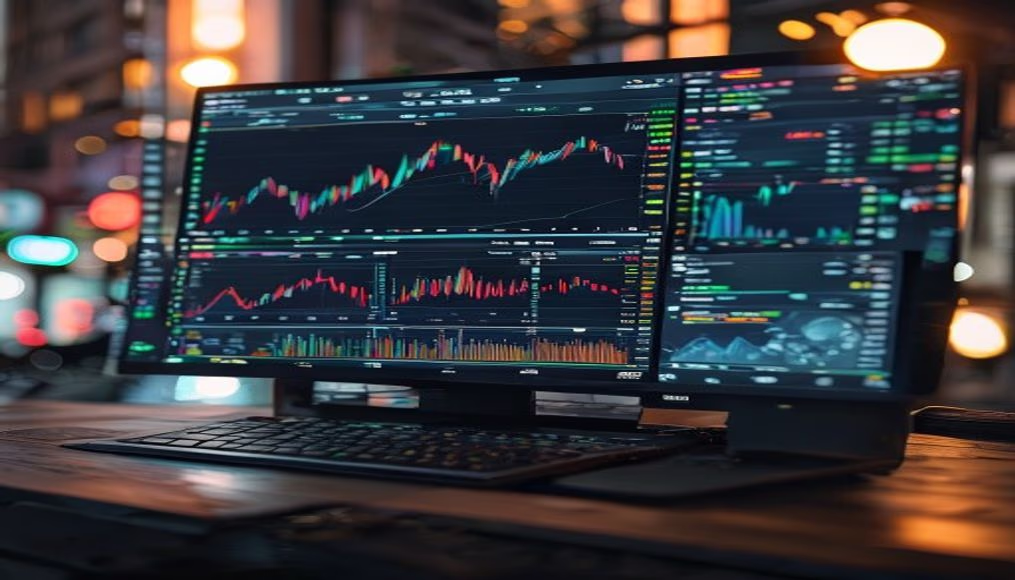
Forex trading screen with multiple charts showing different currency pairs and timeframes, essential for technical analysis.
About this subject
The Forex (foreign exchange) market is the largest and most liquid financial market globally, with a daily trading volume exceeding $7.5 trillion, according to the Bank for International Settlements. Traders use multiple charts on a single screen to simultaneously monitor different currency pairs, such as EUR/USD, GBP/JPY, and USD/BRL, across various timeframes (1 minute, 1 hour, daily, etc.). This setup enables technical analysis strategies like identifying support and resistance levels, candlestick patterns, and indicators such as moving averages and RSI.
Multiple chart windows are common in professional trading desks and among independent traders operating from home. In street photography, such scenes capture the intersection of technology and finance, showing how traders track the market in real time. Using multiple screens or a single monitor with a split layout optimizes quick decision-making, especially during high volatility events like economic data releases (CPI, GDP, interest rate decisions).
Interestingly, many traders organize charts by currency affinity (e.g., USD pairs in one section, yen pairs in another) or by correlation degree. Layout customization varies by strategy: some prefer viewing the same pair across different timeframes, while others prioritize correlated pairs for arbitrage. The rise of online trading and platforms like MetaTrader 4 and 5 has made these configurations accessible to anyone with a computer and internet connection.
Frequently Asked Questions
Why do Forex traders use multiple charts on the same screen?
It allows monitoring several currency pairs and timeframes simultaneously, helping identify trading opportunities and manage risk.
What are the most common indicators on Forex charts?
Moving averages, RSI (Relative Strength Index), MACD, Bollinger Bands, and Fibonacci are widely used for technical analysis.
Is it necessary to have multiple screens to trade Forex professionally?
Not mandatory, but many traders use multiple screens or split layouts for better visualization; beginners can start with a single screen.
Direct URL
https://pub-c7d6a6ea828543ac903a74a341ccb2e1.r2.dev/imagens/forex-trading-screen-multiple-charts-street-photography-v11.avifHow to credit
Include a visible link back to UtilizAí. Copy one of the snippets below:
<a href="https://xn--utiliza-eza.com/en/midia/imagens/forex-trading-screen-multiple-charts-street-photography-v11">Forex trading screen multiple charts</a> by <a href="https://xn--utiliza-eza.com">UtilizAí</a>, licensed under <a href="https://creativecommons.org/licenses/by/4.0/">CC BY 4.0</a>.
[Forex trading screen multiple charts](https://xn--utiliza-eza.com/en/midia/imagens/forex-trading-screen-multiple-charts-street-photography-v11) by [UtilizAí](https://xn--utiliza-eza.com), CC BY 4.0
License: CC-BY-4.0





