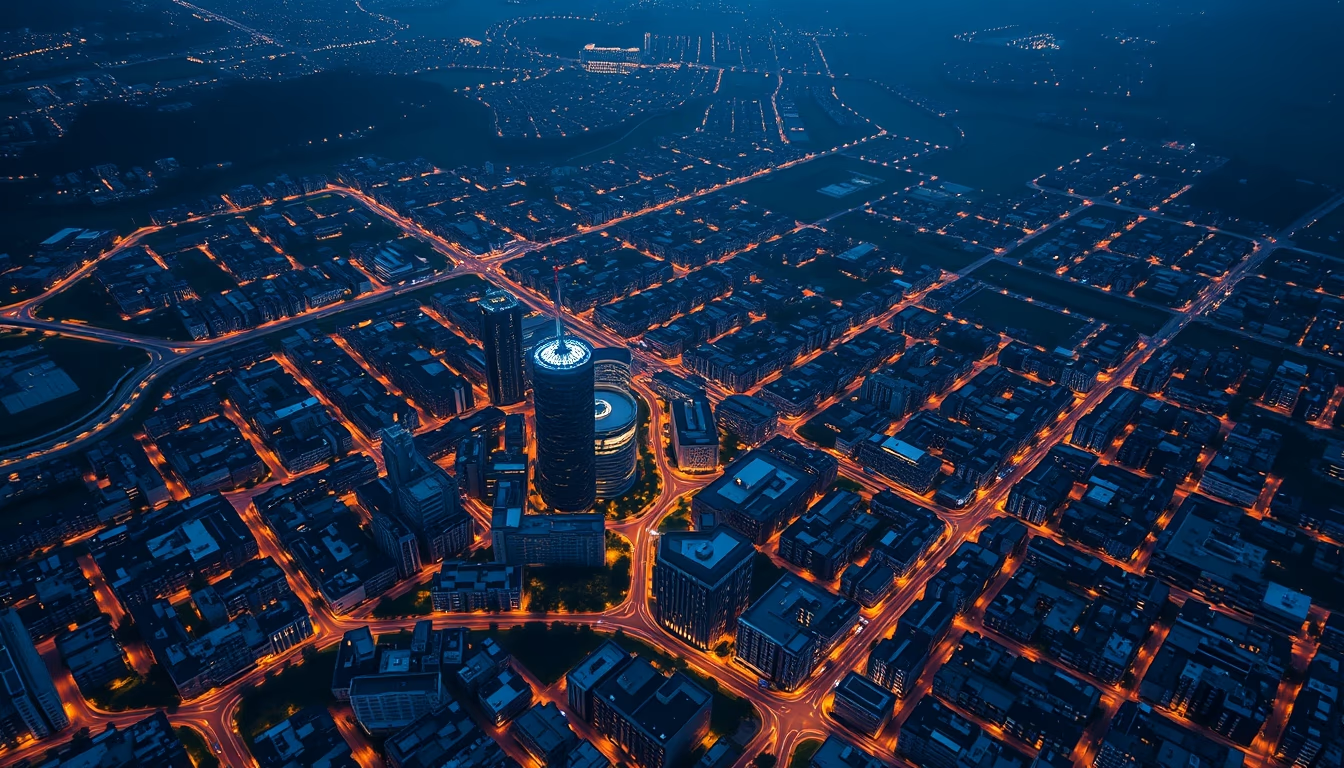
Urban heat island map
1344×768 · AVIF · CC BY 4.0
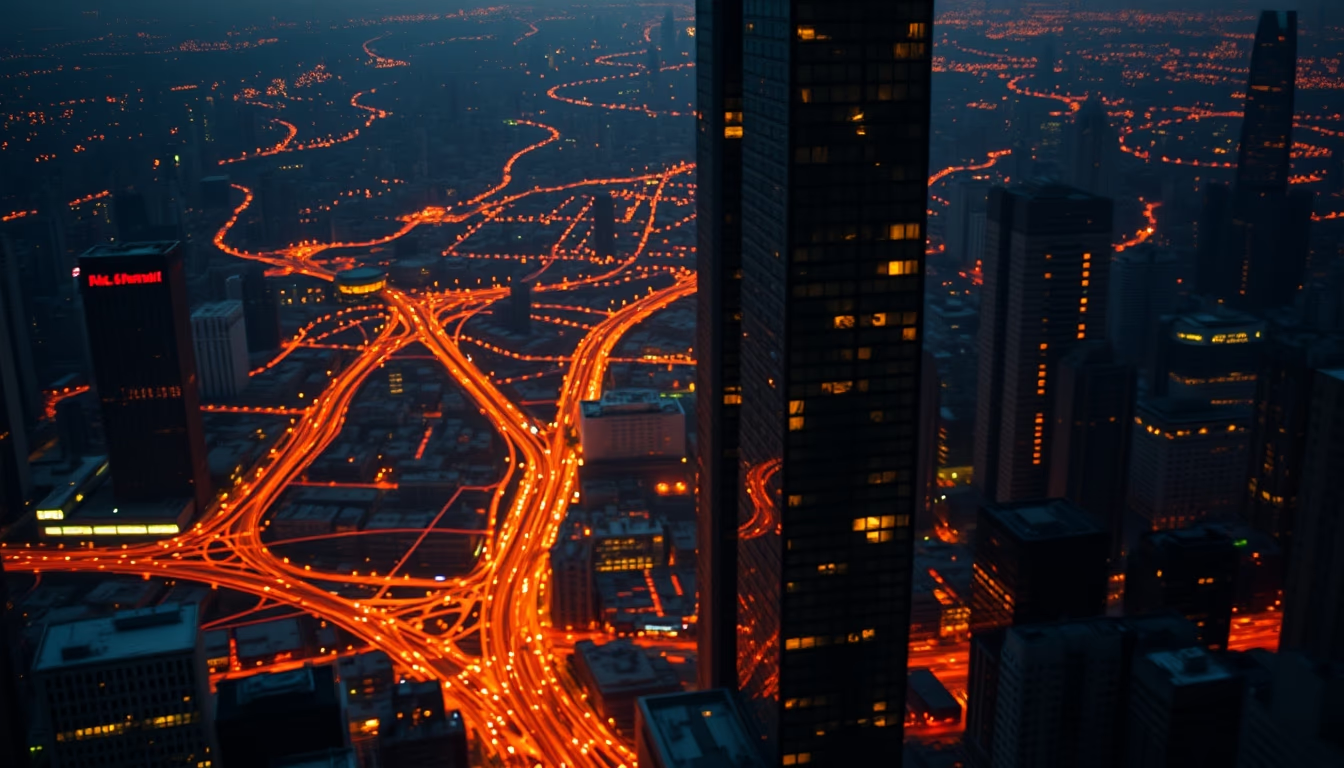
Urban heat island maps are visual representations of temperature differences between urban and rural areas, based on satellite data.
About this subject
Urban heat islands are climatic phenomena where densely built areas experience significantly higher temperatures than surrounding rural regions. This effect mainly results from replacing natural surfaces with asphalt, concrete, and other materials that absorb and retain heat, along with reduced green spaces and heat emitted by vehicles and cooling systems. Urban heat island maps are generated from thermal sensors aboard satellites such as Landsat and MODIS, which capture infrared radiation emitted by the Earth's surface.
In Brazil, cities like São Paulo, Rio de Janeiro, and Brasília have well-documented heat islands. Studies show temperature differences can exceed 10°C between urban centers and nearby rural areas. These maps are essential tools for urban planning, as they help identify hotter neighborhoods and guide policies such as tree planting, creation of parks, green roofs, and reflective materials. Temporal analysis of maps allows monitoring the effectiveness of these interventions over time.
Besides air temperature, these maps typically show land surface temperature (LST), which directly affects thermal comfort and public health, especially during heat waves. Satellite data from sensors like NASA's ECOSTRESS offer spatial resolution up to 70 meters, enabling mapping of microclimates within cities. This information is crucial for vulnerable communities, which often live in areas with less green infrastructure and greater exposure to extreme heat.
Frequently Asked Questions
How are urban heat island maps generated?
Maps are created from satellite images with thermal sensors like Landsat and MODIS. They measure infrared radiation emitted by the surface, calculate land surface temperature, and compare it with nearby rural areas.
Why are these maps important for urban planning?
They help identify the hottest areas of a city, guiding mitigation actions such as tree planting, creation of green spaces, reflective materials, and green roofs, reducing thermal discomfort and health risks.
Are urban heat islands the same in all cities?
No. Intensity varies with city size, building density, vegetation cover, regional climate, and materials used. Cities in tropical climates, like in Brazil, may show even larger differences.
Direct URL
https://pub-c7d6a6ea828543ac903a74a341ccb2e1.r2.dev/imagens/urban-heat-island-map-rembrandt-lighting-dramatic-shadows-fresh13.avifHow to credit
Include a visible link back to UtilizAí. Copy one of the snippets below:
<a href="https://xn--utiliza-eza.com/en/midia/imagens/urban-heat-island-map-rembrandt-lighting-dramatic-shadows-fresh13">Urban heat island map</a> by <a href="https://xn--utiliza-eza.com">UtilizAí</a>, licensed under <a href="https://creativecommons.org/licenses/by/4.0/">CC BY 4.0</a>.
[Urban heat island map](https://xn--utiliza-eza.com/en/midia/imagens/urban-heat-island-map-rembrandt-lighting-dramatic-shadows-fresh13) by [UtilizAí](https://xn--utiliza-eza.com), CC BY 4.0
License: CC-BY-4.0