Urban heat island map
1344×768 · AVIF · CC BY 4.0
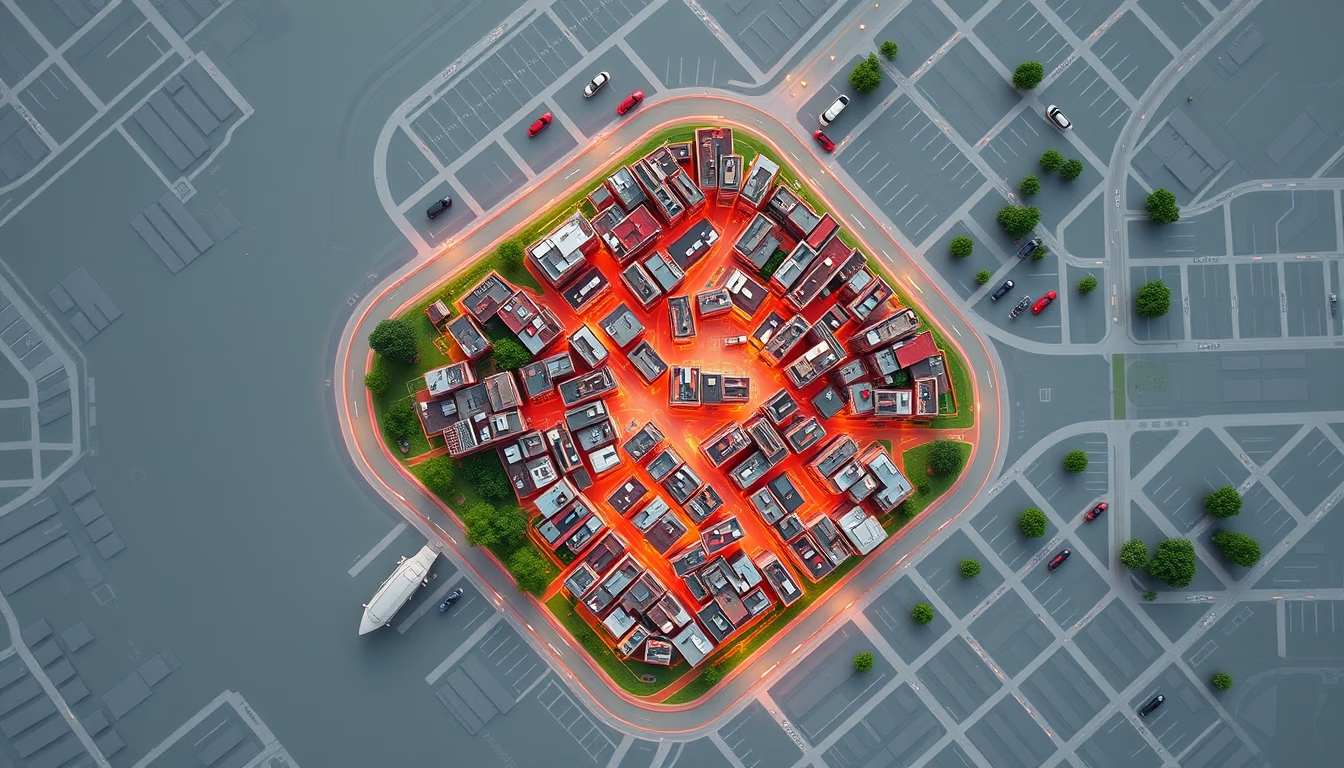
Urban heat island maps reveal thermal differences between densely built areas and green zones, essential for urban planning.
About this subject
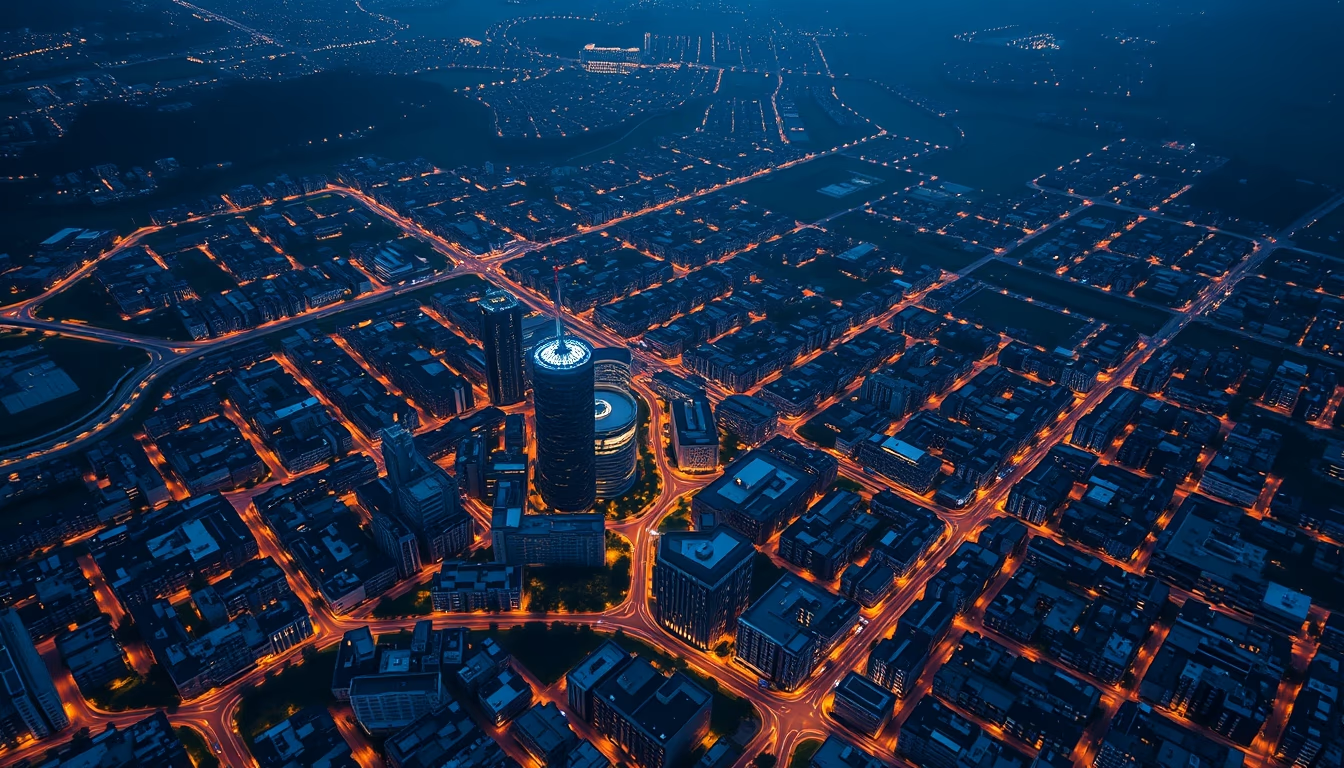
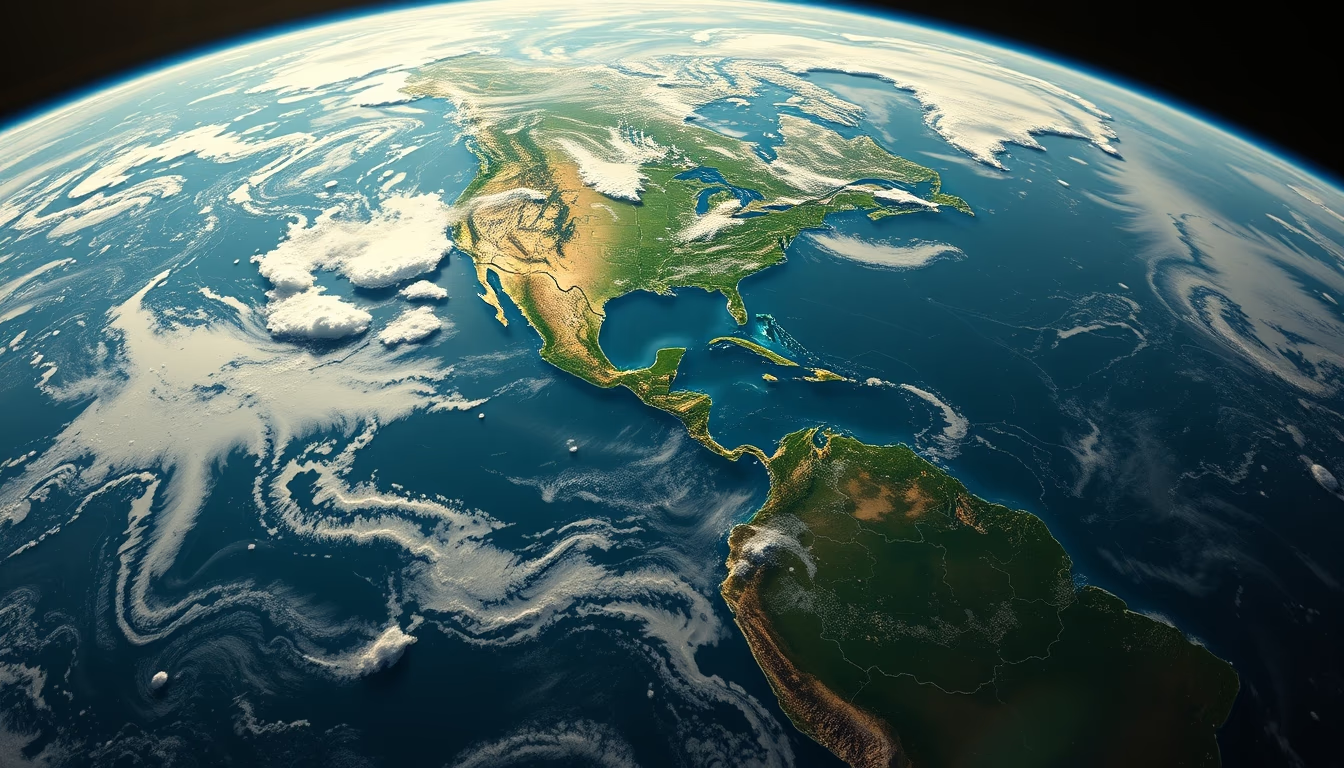
Urban heat islands are metropolitan areas that experience significantly higher temperatures than surrounding rural regions, due to the replacement of natural surfaces with concrete, asphalt, and buildings. These maps, generated by satellites such as NASA's Landsat and MODIS, capture thermal infrared radiation to create surface temperature mosaics. Global data from 2023 show that cities like São Paulo, Tokyo, and Phoenix can be 5°C to 10°C warmer than the countryside, exacerbated by lack of vegetation and urban geometry that traps heat.
The utility of these maps goes beyond simple visualization. Urban planners use them to identify hotspots and guide policies like tree planting, cool roofs, and permeable pavements. In Curitiba, Brazil, satellite data guided the implementation of linear parks that reduced local temperatures by up to 2°C. In Europe, the Copernicus project provides free heat maps for municipalities, helping mitigate heatwaves that kill thousands annually.
Interestingly, urban heat islands also affect energy consumption and public health. Studies link warmer nights to increased air conditioning use and spikes in cardiovascular disease. Coastal cities like Rio de Janeiro face additional challenges with humidity, intensifying thermal discomfort. In 2021, São Paulo's city hall launched an urban microclimate atlas based on satellite images, guiding the planting of 300,000 trees in priority areas.
Emerging technologies, such as low-cost sensors on drones, complement satellites, enabling resolutions down to 1 meter. However, global maps still rely on missions like ECOSTRESS on the ISS, which maps evapotranspiration and water stress. Integration with artificial intelligence promises to predict the evolution of heat islands as cities grow, a vital tool for sustainable development.
Frequently Asked Questions
What is an urban heat island?
It is a phenomenon where urban areas are significantly warmer than surrounding rural areas, due to heat absorption by surfaces like asphalt and concrete, and lack of vegetation.
How are urban heat island maps created?
They are generated by satellites with infrared sensors that measure surface thermal radiation. The data is processed into mosaics showing temperature distribution across cities.
Why are these maps important for urban planning?
They identify heat hotspots, enabling targeted actions like tree planting, green roofs, and cool pavements, reducing heat stress and energy consumption.
Direct URL
https://pub-c7d6a6ea828543ac903a74a341ccb2e1.r2.dev/imagens/urban-heat-island-map-isometric-flat-lay-fresh10.avifHow to credit
Include a visible link back to UtilizAí. Copy one of the snippets below:
<a href="https://xn--utiliza-eza.com/en/midia/imagens/urban-heat-island-map-isometric-flat-lay-fresh10">Urban heat island map</a> by <a href="https://xn--utiliza-eza.com">UtilizAí</a>, licensed under <a href="https://creativecommons.org/licenses/by/4.0/">CC BY 4.0</a>.
[Urban heat island map](https://xn--utiliza-eza.com/en/midia/imagens/urban-heat-island-map-isometric-flat-lay-fresh10) by [UtilizAí](https://xn--utiliza-eza.com), CC BY 4.0
License: CC-BY-4.0