Urban heat island map
1344×768 · AVIF · CC BY 4.0
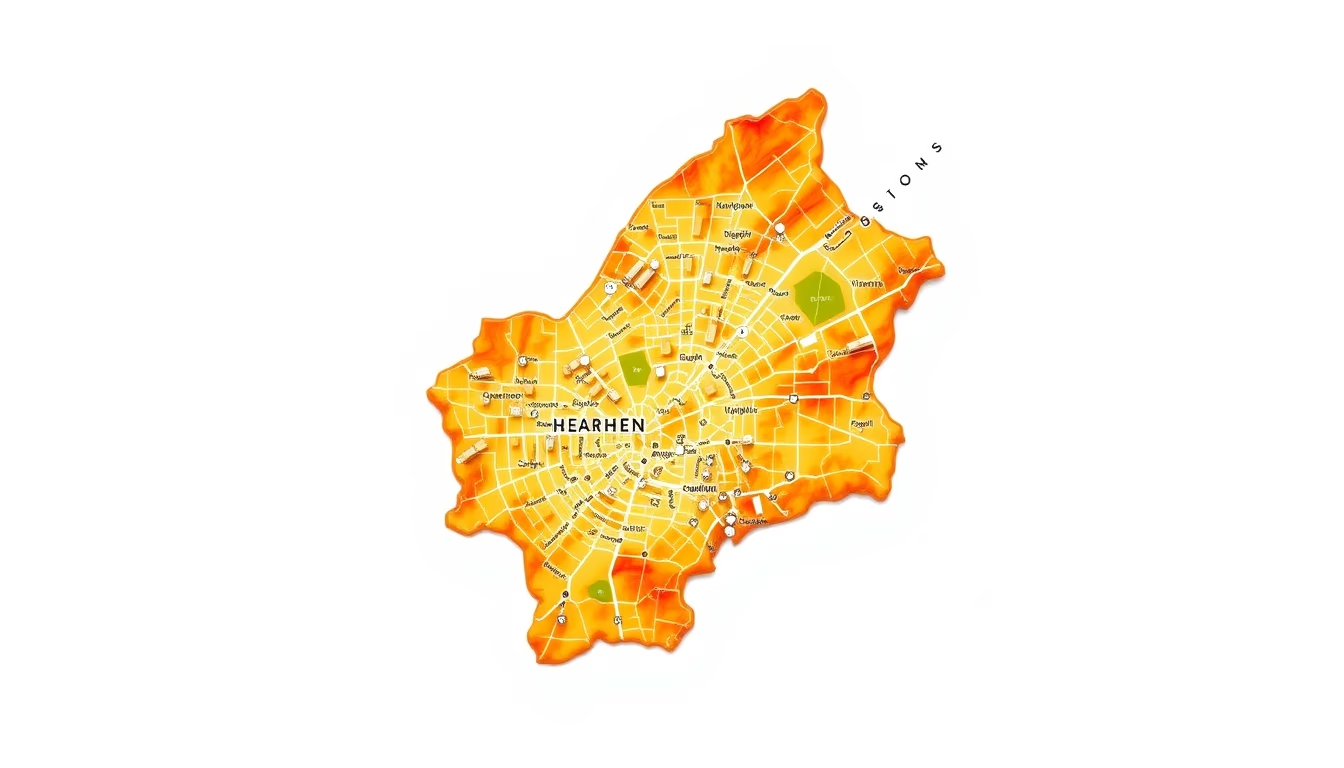
Urban heat island maps reveal temperature differences between built-up and vegetated areas, essential for city climate planning.
About this subject
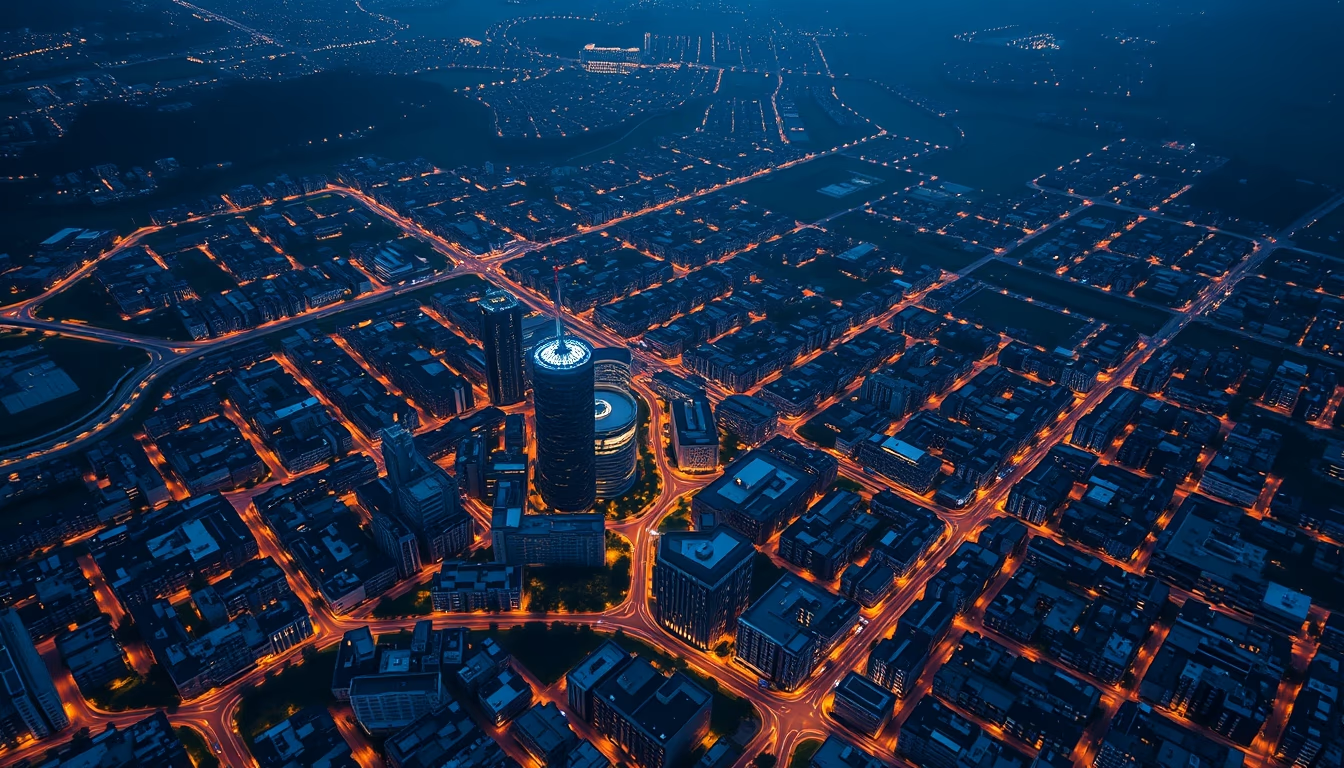
Urban heat islands are climatic phenomena where metropolitan areas experience higher temperatures than surrounding rural zones. This effect is caused by replacing natural surfaces with materials like asphalt, concrete, and dark roofs, which absorb and retain heat. Maps derived from satellites, such as those from the Landsat program or MODIS sensors, allow visualization of the spatial distribution of surface heat. Cities like São Paulo and Rio de Janeiro, for example, show temperature differences of up to 10°C between densely built central districts and parks or forest reserves.
Systematic mapping of urban heat islands gained momentum in the 1990s with advances in thermal remote sensing. Today, cities like Curitiba and Belo Horizonte use these maps to guide urban greening policies and green roofs. Nighttime surface temperature data is especially important as it indicates thermal discomfort during sleep. The Brazilian Space Agency (AEB) and INPE provide free thermal imagery for the national territory, enabling local governments to conduct detailed assessments.
Beyond urban planning, these maps are applied in public health studies, showing correlations between heat waves and elderly mortality. Vegetation presence can reduce temperature by up to 3°C within a 100-meter radius, according to USP studies. Technologies such as airborne sensors and drones with thermal cameras complement satellite data, offering resolutions below 1 meter for critical areas. Continuous mapping allows monitoring of intervention effectiveness, such as the installation of squares and green corridors.
Frequently Asked Questions
What causes the urban heat island effect?
Replacement of natural surfaces with materials like asphalt, concrete, and dark roofs that absorb and retain heat, along with reduced vegetation and heat release from vehicles and air conditioning systems.
How are urban heat island maps generated?
They use thermal sensors on satellites (Landsat, MODIS) or drones that measure surface temperature. Data is processed to create color images showing temperature variations across the city.
How are these maps applied in Brazil?
City governments use the maps to plan tree planting, green roofs, and ventilation corridors. They also assist public health studies on heat wave impacts and locating cool islands.
Direct URL
https://pub-c7d6a6ea828543ac903a74a341ccb2e1.r2.dev/imagens/urban-heat-island-map-commercial-product-photography-fresh2.avifHow to credit
Include a visible link back to UtilizAí. Copy one of the snippets below:
<a href="https://xn--utiliza-eza.com/en/midia/imagens/urban-heat-island-map-commercial-product-photography-fresh2">Urban heat island map</a> by <a href="https://xn--utiliza-eza.com">UtilizAí</a>, licensed under <a href="https://creativecommons.org/licenses/by/4.0/">CC BY 4.0</a>.
[Urban heat island map](https://xn--utiliza-eza.com/en/midia/imagens/urban-heat-island-map-commercial-product-photography-fresh2) by [UtilizAí](https://xn--utiliza-eza.com), CC BY 4.0
License: CC-BY-4.0