Investment dashboard with portfolio breakdown chart
1344×768 · AVIF · CC BY 4.0
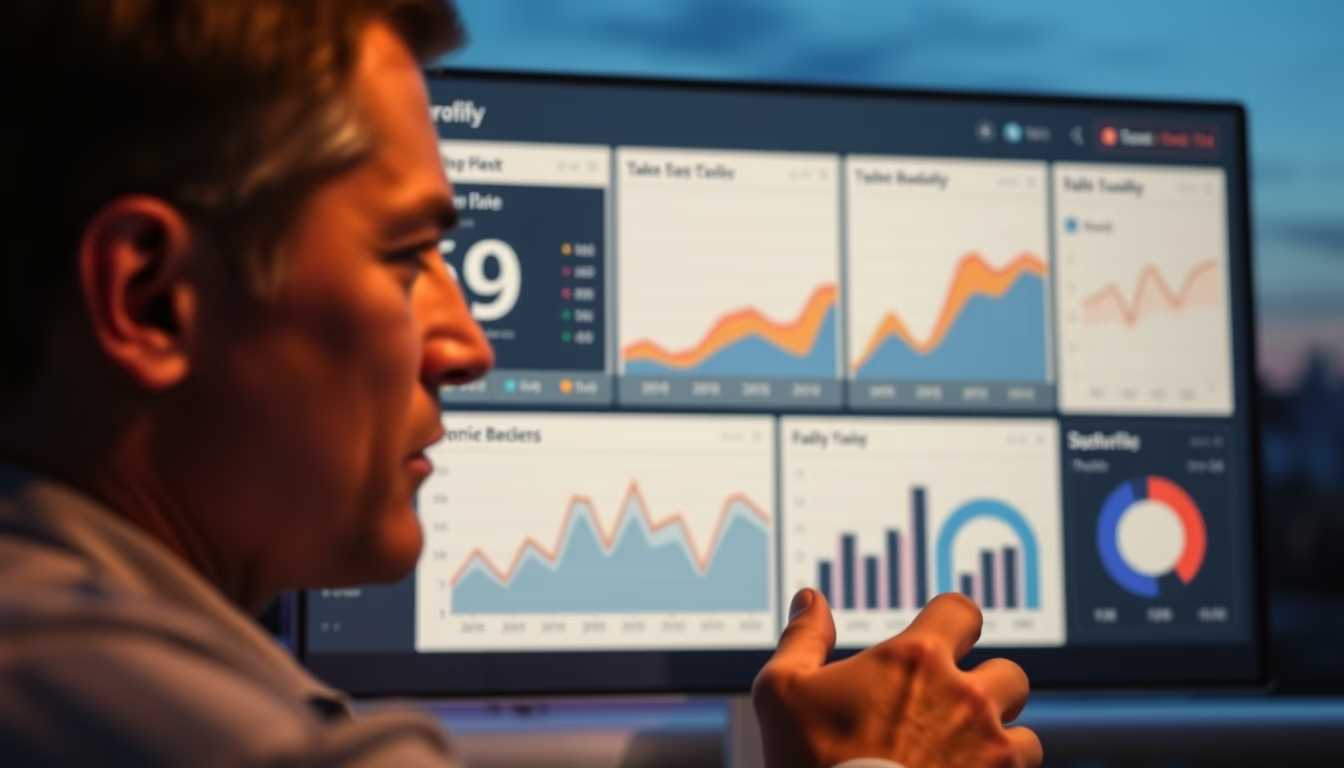
Investment dashboard displaying a detailed portfolio chart, an essential tool for modern financial analysis.
About this subject
Investment dashboards are visual panels that consolidate real-time financial data, enabling investors to track their portfolio performance. The portfolio chart, often in pie or stacked bar format, shows asset allocation across classes such as stocks, fixed income, real estate funds, and international assets. This tool is crucial for data-driven decision-making, reducing information asymmetry in markets.
In Brazil, dashboard usage grew with the popularization of robo-advisors and digital brokerages. According to the Brazilian Financial and Capital Markets Association (Anbima), the number of individual investors on B3 jumped from 800,000 in 2018 to over 5 million in 2023. Platforms like TradeMap and Kinvo offer integration with B3 for automatic position updates.
Portfolio visualization helps identify excessive concentration in a single asset or sector, and verifies adherence to the defined strategy. For example, a long-term investor can use the chart to rebalance the portfolio, selling overperforming assets and buying underperforming ones. Studies show that investors who regularly monitor their portfolios achieve risk-adjusted returns up to 1.5% higher per year.
Technologies such as artificial intelligence and machine learning are being incorporated into dashboards to generate predictive alerts, like buy or sell recommendations based on market trends. Data security is ensured through end-to-end encryption and two-factor authentication, meeting compliance audit requirements.
Frequently Asked Questions
What is an investment dashboard?
It is a visual panel that consolidates real-time financial data such as balance, returns, and asset allocation to aid investor decision-making.
How does the portfolio chart help with diversification?
It shows the distribution of investments by asset class, allowing identification of excessive concentration in a sector or asset, guiding rebalancing.
Which Brazilian platforms offer investment dashboards?
TradeMap, Kinvo, and B3 itself offer integrated dashboards. Brokerages like XP, BTG, and Rico also provide their own tools.
Direct URL
https://pub-c7d6a6ea828543ac903a74a341ccb2e1.r2.dev/imagens/investment-dashboard-with-portfolio-breakdown-chart-editorial-portrait-twilight-blue-hour.avifHow to credit
Include a visible link back to UtilizAí. Copy one of the snippets below:
<a href="https://xn--utiliza-eza.com/en/midia/imagens/investment-dashboard-with-portfolio-breakdown-chart-editorial-portrait-twilight-blue-hour">Investment dashboard with portfolio breakdown chart</a> by <a href="https://xn--utiliza-eza.com">UtilizAí</a>, licensed under <a href="https://creativecommons.org/licenses/by/4.0/">CC BY 4.0</a>.
[Investment dashboard with portfolio breakdown chart](https://xn--utiliza-eza.com/en/midia/imagens/investment-dashboard-with-portfolio-breakdown-chart-editorial-portrait-twilight-blue-hour) by [UtilizAí](https://xn--utiliza-eza.com), CC BY 4.0
License: CC-BY-4.0





