Investment dashboard with portfolio breakdown chart
1344×768 · AVIF · CC BY 4.0
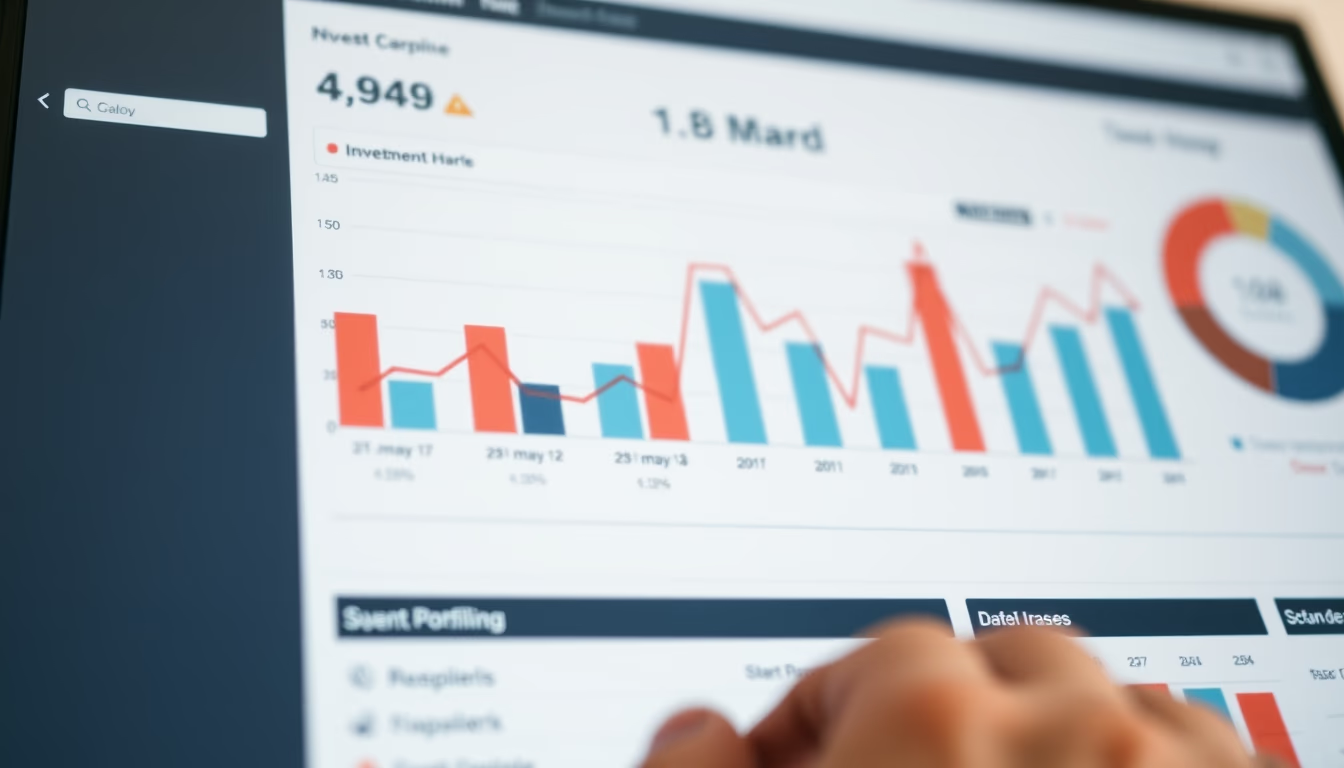
Investment dashboard showing a pie chart with portfolio allocation across stocks, fixed income, and real estate funds, reflecting typical Brazilian investor diversification.
About this subject
An investment dashboard is a crucial tool for investors tracking portfolio performance in real time. In Brazil, the rise of digital brokerages and investment platforms has made these dashboards accessible even to small investors. The pie chart, or portfolio breakdown chart, is one of the most common ways to visualize capital allocation across asset classes such as stocks (equities), fixed income (government and corporate bonds), and real estate funds (FIIs). This segmentation helps identify whether the portfolio is diversified, reducing sector-specific risks.
In the Brazilian context, fixed income still dominates many investors' allocations due to the historically high Selic rate, which made instruments like Tesouro Direto and CDBs very attractive. However, with falling interest rates in recent years, there has been a growing shift toward equities and real estate funds, which offer real returns and inflation protection. The image captures this transition, likely showing a balanced split among the three categories.
The close-up macro shot with overcast soft daylight lighting suggests a professional, serious environment typical of meeting rooms or home offices of experienced investors. The soft lighting avoids screen glare, highlighting data without distractions. This visualization is common in monthly brokerage reports and platforms like TradeMap or MyProfit, which allow customized performance analysis.
Interestingly, diversification is a key principle taught by Brazilian financial educators such as Gustavo Cerbasi and Thiago Nigro. A well-balanced portfolio across fixed income, equities, and real estate can better withstand market fluctuations. The dashboard in the image symbolizes this strategy, with colors and proportions indicating a conscious allocation, likely from an investor seeking balance between safety and returns.
Frequently Asked Questions
What is an investment dashboard?
It is a visual interface that consolidates information about a portfolio's performance, including charts, indicators, and asset allocation, enabling informed decision-making.
Why is diversification across fixed income, stocks, and real estate funds important?
Diversification reduces risk by spreading capital across asset classes that react differently to economic events. Fixed income offers safety, while stocks and real estate funds provide growth potential and inflation protection.
What is the advantage of using a pie chart for portfolio allocation?
A pie chart intuitively shows the proportion of each asset in the total portfolio, making it easy to spot overconcentration and assist in rebalancing.
Direct URL
https://pub-c7d6a6ea828543ac903a74a341ccb2e1.r2.dev/imagens/investment-dashboard-with-portfolio-breakdown-chart-closeup-macro-shot-overcast-soft-daylight.avifHow to credit
Include a visible link back to UtilizAí. Copy one of the snippets below:
<a href="https://xn--utiliza-eza.com/en/midia/imagens/investment-dashboard-with-portfolio-breakdown-chart-closeup-macro-shot-overcast-soft-daylight">Investment dashboard with portfolio breakdown chart</a> by <a href="https://xn--utiliza-eza.com">UtilizAí</a>, licensed under <a href="https://creativecommons.org/licenses/by/4.0/">CC BY 4.0</a>.
[Investment dashboard with portfolio breakdown chart](https://xn--utiliza-eza.com/en/midia/imagens/investment-dashboard-with-portfolio-breakdown-chart-closeup-macro-shot-overcast-soft-daylight) by [UtilizAí](https://xn--utiliza-eza.com), CC BY 4.0
License: CC-BY-4.0





