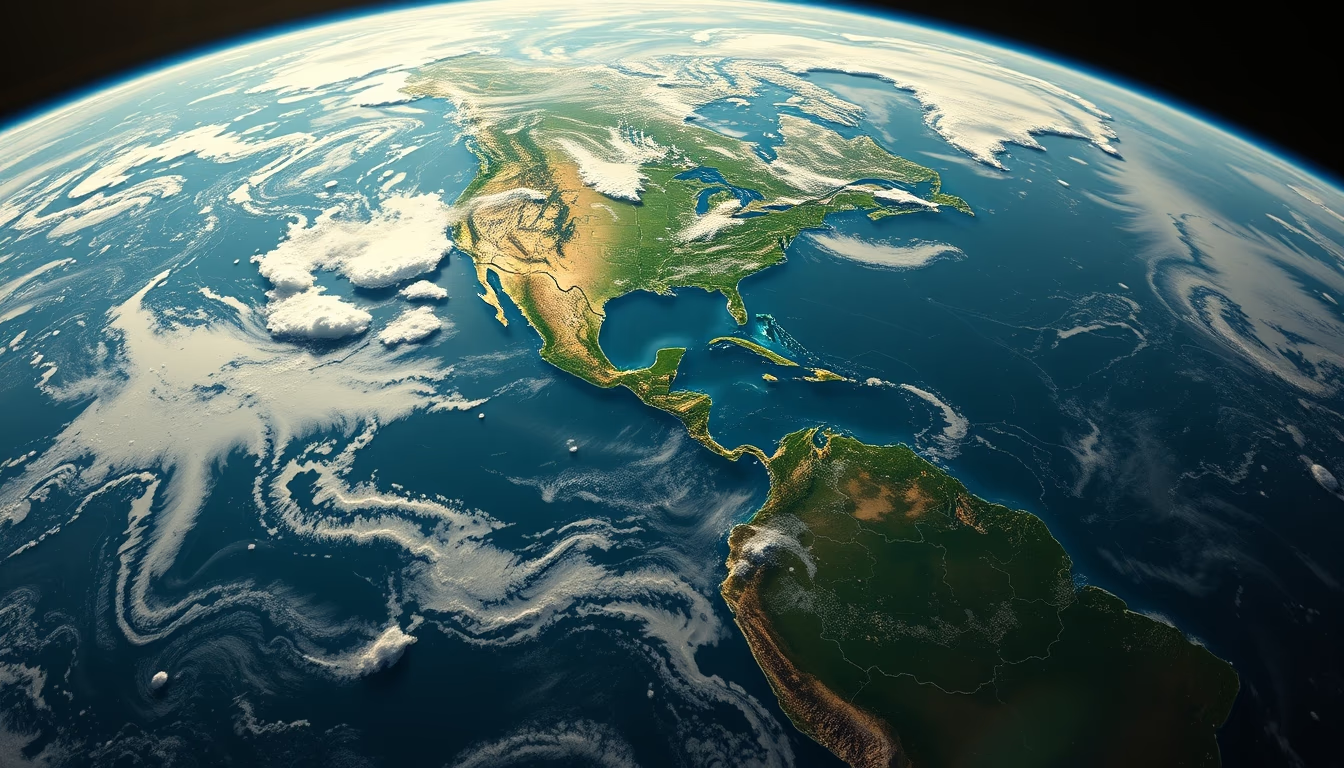
Urban heat island map
1344×768 · AVIF · CC BY 4.0

Satellite-derived urban heat island maps reveal how cities trap more heat than rural areas, impacting urban planning and public health.
About this subject
Urban heat islands occur when urbanized areas experience significantly higher temperatures than surrounding rural regions due to heat absorption and retention by surfaces like concrete and asphalt. Satellites such as NASA's Landsat and MODIS (Moderate Resolution Imaging Spectroradiometer) are widely used to map these thermal differences. They capture land surface temperature data at different times of day and night, enabling detailed maps that highlight the hottest spots in cities.
Thermal remote sensing uses infrared bands to measure surface radiation. Combining these measurements with land use models, it is possible to identify critical areas where temperatures can be 5°C to 10°C higher than nearby parks or green zones. Cities like São Paulo, Rio de Janeiro, and Belo Horizonte already use these maps to guide policies on urban tree planting, green roofs, and permeable pavements.
A recent study published in Remote Sensing showed that vegetation and water bodies can reduce local temperatures by 2°C to 4°C, while densely built areas amplify heating. Satellite mapping also helps predict heatwaves, a growing risk with climate change. Moreover, the tool is essential for smart city planning, enabling tax incentives for sustainable constructions.
Interestingly, the heat island effect is not exclusive to large metropolises; medium-sized cities show similar patterns. Data from satellites like ESA's Sentinel-3 offer 1 km spatial resolution, while NASA's ECOSTRESS provides measurements at 70-meter scales, ideal for local analysis. These maps are freely available from space agencies, allowing city managers and researchers to develop evidence-based mitigation strategies.
Frequently Asked Questions
What is an urban heat island map?
It is a visual representation of temperature differences between urban and rural areas, created from satellite data that measures infrared radiation from the Earth's surface.
How do satellites measure temperature for these maps?
Satellites like Landsat and MODIS use thermal sensors that capture surface emitted radiation in infrared wavelengths, converting it to land surface temperature.
Are these maps useful for urban planning?
Yes, they help identify hotter areas, guide tree planting, green roofs, and permeable pavements, and support heatwave mitigation policies.
Direct URL
https://pub-c7d6a6ea828543ac903a74a341ccb2e1.r2.dev/imagens/urban-heat-island-map-fish-eye-wide-angle-fresh11.avifHow to credit
Include a visible link back to UtilizAí. Copy one of the snippets below:
<a href="https://xn--utiliza-eza.com/en/midia/imagens/urban-heat-island-map-fish-eye-wide-angle-fresh11">Urban heat island map</a> by <a href="https://xn--utiliza-eza.com">UtilizAí</a>, licensed under <a href="https://creativecommons.org/licenses/by/4.0/">CC BY 4.0</a>.
[Urban heat island map](https://xn--utiliza-eza.com/en/midia/imagens/urban-heat-island-map-fish-eye-wide-angle-fresh11) by [UtilizAí](https://xn--utiliza-eza.com), CC BY 4.0
License: CC-BY-4.0