Urban heat island map
1344×768 · AVIF · CC BY 4.0

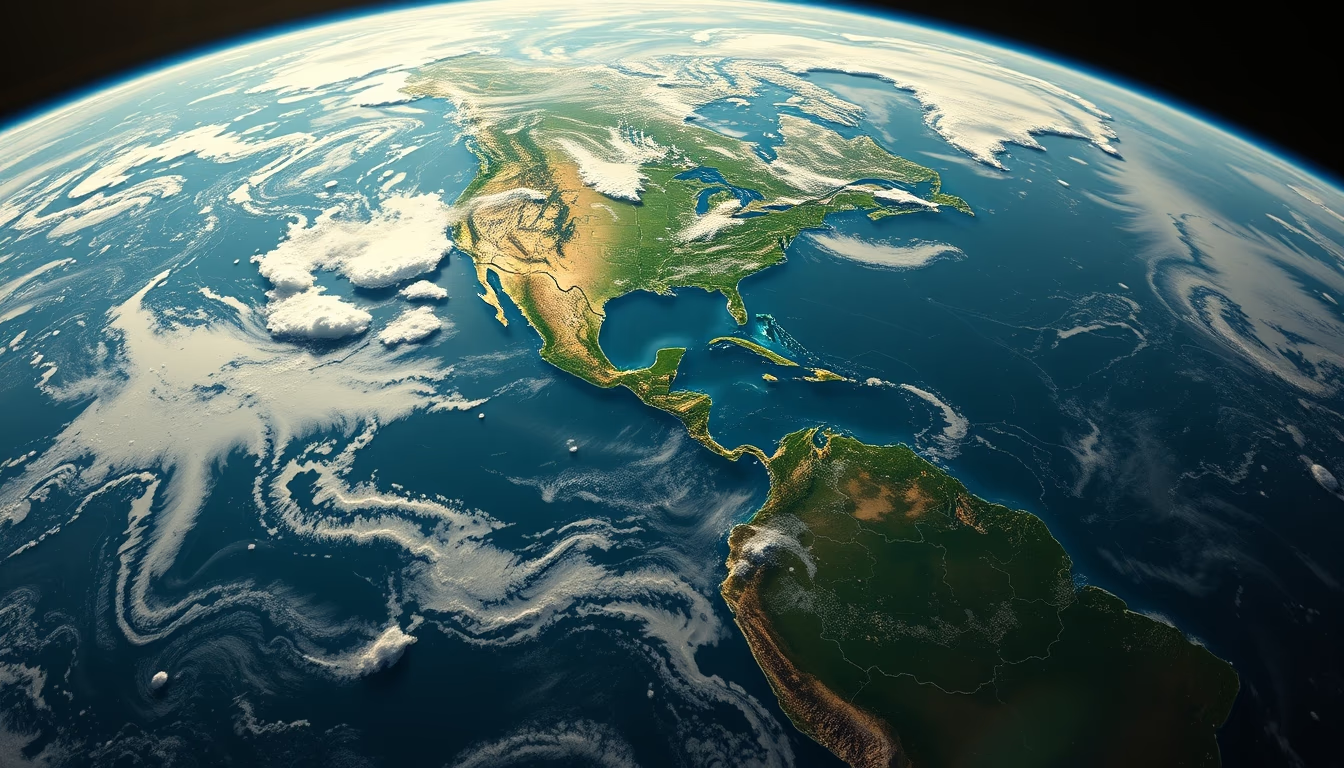
Urban heat island maps are generated by satellites and reveal how cities retain more heat than surrounding rural areas.
About this subject
Urban heat islands are climatic phenomena where metropolitan areas experience significantly higher temperatures than their surrounding rural zones. This effect results mainly from replacing natural surfaces with impermeable and dark materials like asphalt and concrete, which absorb and re-emit solar radiation intensely. Data from satellites such as Landsat and MODIS (Moderate Resolution Imaging Spectroradiometer) enable precise mapping of these thermal differences at regional and global scales.
Heat island maps are crucial for sustainable urban planning. They identify critical areas needing interventions like green roofs, permeable pavements, and increased vegetation cover. Cities like São Paulo and Rio de Janeiro use this data to mitigate heatwave effects and improve quality of life. According to NASA, urban core temperatures can be up to 7°C higher than nearby rural areas at night.
Thermal remote sensing also helps understand how urban form influences microclimate. Street orientation, building height, and construction density affect ventilation and shading, factors directly linked to heat island intensity. Studies show that neighborhoods with adequate tree cover can reduce surface temperatures by up to 4°C, proving the importance of green infrastructure policies.
Beyond local impact, urban heat islands affect electricity consumption, increasing demand for air conditioning and contributing to greenhouse gas emissions. Periodic mapping allows monitoring of these areas' evolution and evaluating the effectiveness of climate adaptation measures, making them essential tools for urban resilience in the face of climate change.
Frequently Asked Questions
What causes urban heat islands?
The main cause is the replacement of natural surfaces with heat-absorbing materials like asphalt, concrete, and dark roofs, along with lack of vegetation and heat generated by human activities.
How do satellites map heat islands?
Satellites equipped with infrared sensors measure land surface temperature. Data from Landsat and MODIS satellites are processed to create maps showing thermal differences between urban and rural areas.
What solutions reduce heat islands?
Green roofs, permeable pavements, increased green spaces, reflective materials (cool roofs), and urban planning that favors natural ventilation are effective for mitigation.
Direct URL
https://pub-c7d6a6ea828543ac903a74a341ccb2e1.r2.dev/imagens/urban-heat-island-map-fine-art-photography-fresh0.avifHow to credit
Include a visible link back to UtilizAí. Copy one of the snippets below:
<a href="https://xn--utiliza-eza.com/en/midia/imagens/urban-heat-island-map-fine-art-photography-fresh0">Urban heat island map</a> by <a href="https://xn--utiliza-eza.com">UtilizAí</a>, licensed under <a href="https://creativecommons.org/licenses/by/4.0/">CC BY 4.0</a>.
[Urban heat island map](https://xn--utiliza-eza.com/en/midia/imagens/urban-heat-island-map-fine-art-photography-fresh0) by [UtilizAí](https://xn--utiliza-eza.com), CC BY 4.0
License: CC-BY-4.0