Urban heat island map
1344×768 · AVIF · CC BY 4.0

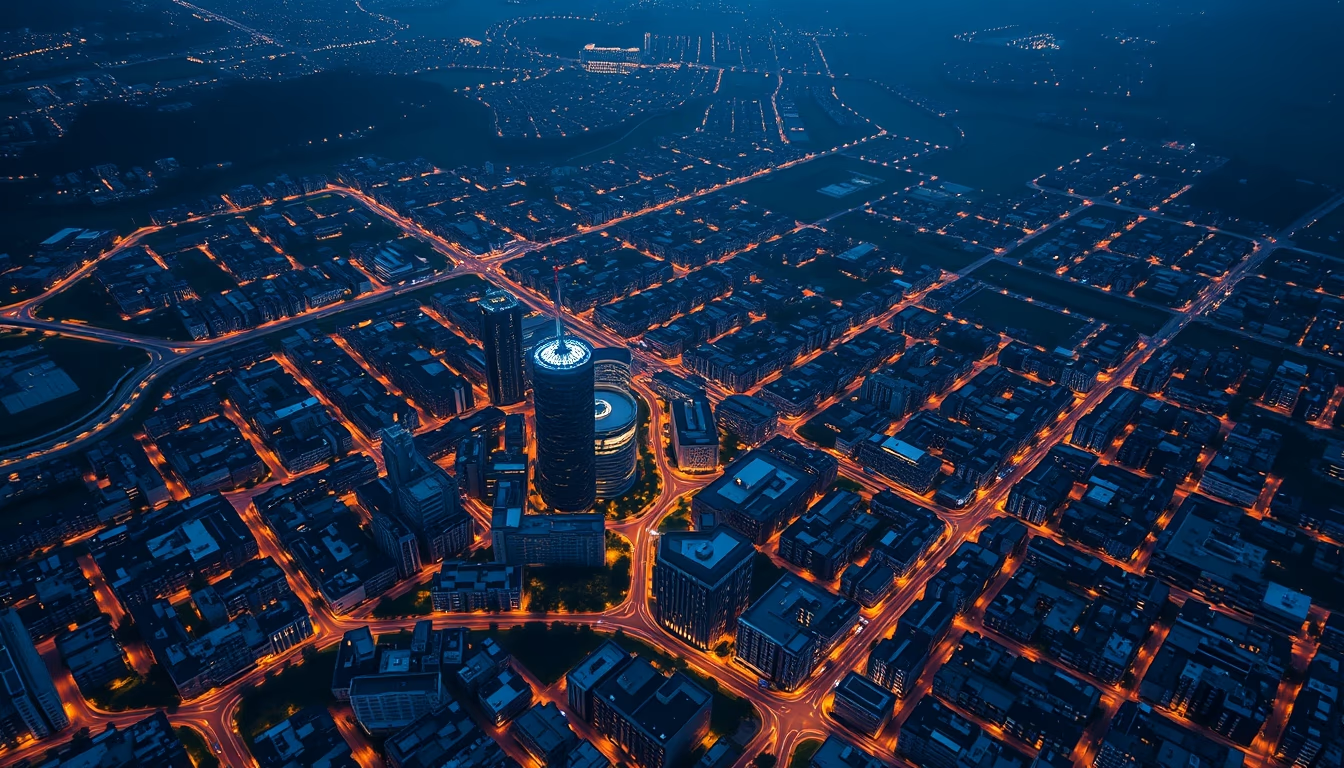
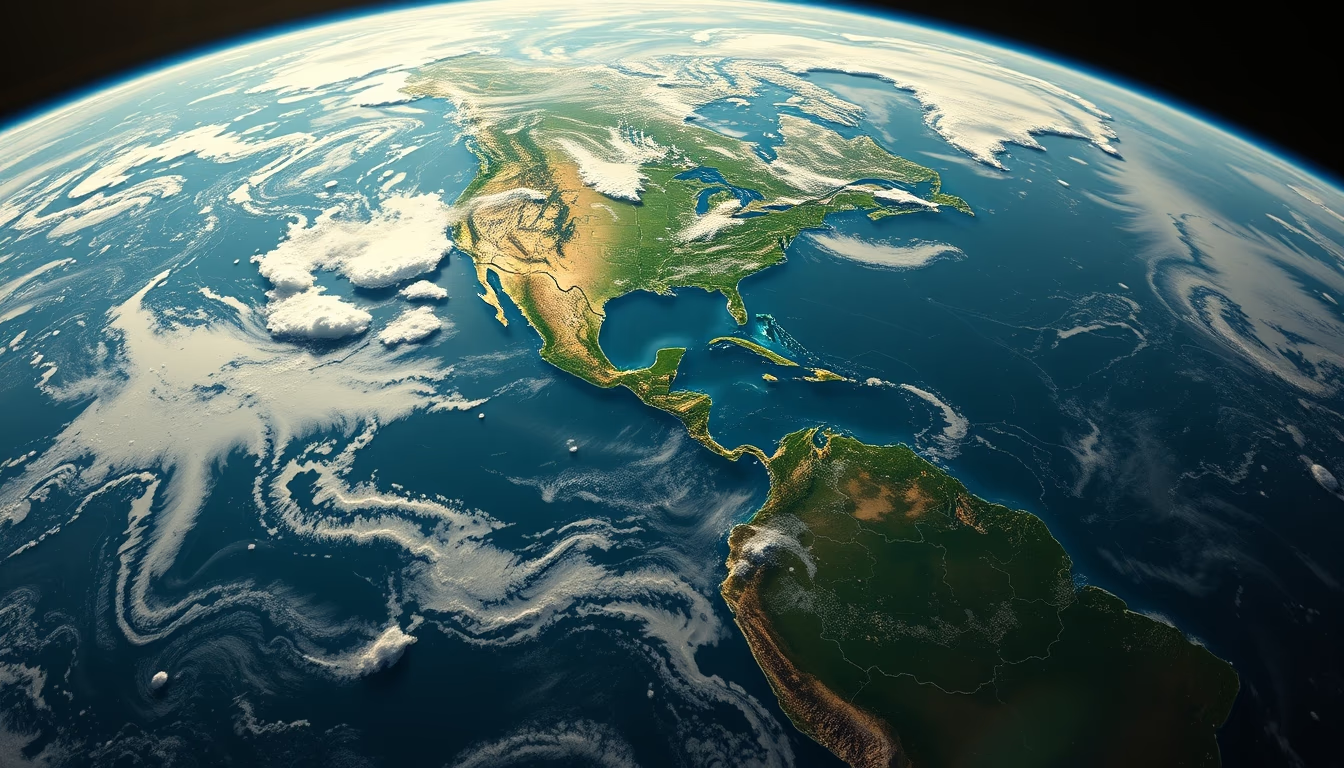
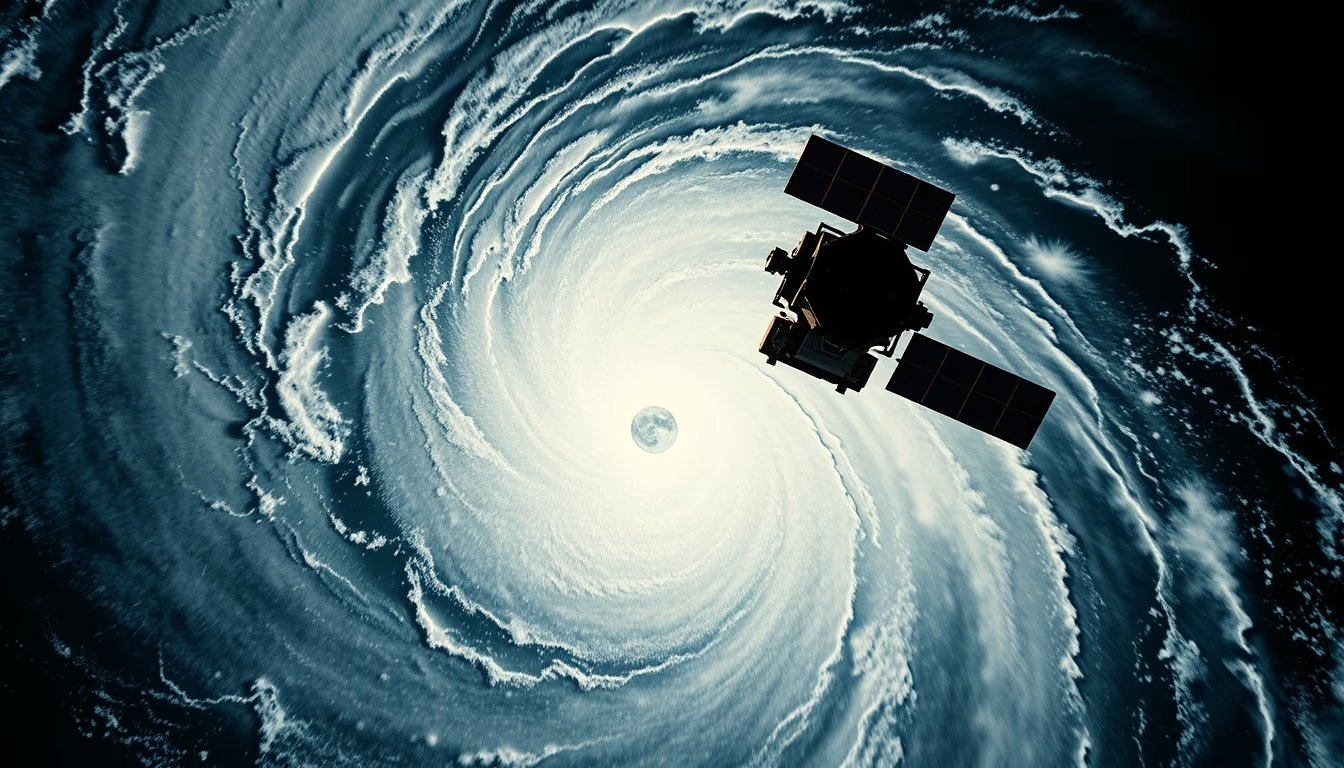
Urban heat island maps are generated by satellites and show temperature differences between city centers and surrounding areas.
About this subject
The urban heat island effect occurs when built-up areas experience significantly higher temperatures than nearby rural or green zones. Satellite data from sensors like Landsat and MODIS enable high-resolution mapping of these thermal differences. In cities such as São Paulo, Brazil, the temperature gap between the downtown core and adjacent parks can reach 10°C, worsening heat discomfort and raising air conditioning energy demand.
Replacing natural surfaces with asphalt, concrete, and dark roofing reduces solar reflection and increases heat absorption. Human activities, vehicles, industry, and air conditioning, also release waste heat. Urban thermal maps are crucial for planners: they highlight hotspots where tree planting, green roofs, or reflective pavements can mitigate the effect. In Brazil, initiatives like “SP mais Verde” use such data to prioritize interventions.
The World Meteorological Organization warns that urban heat islands can exacerbate heatwaves, impacting public health. A 2023 NASA map of Rio de Janeiro showed that neighborhoods in the North Zone were up to 6°C hotter than the Tijuca Forest. Awareness of these thermal patterns is the first step toward more climate-resilient cities.
Frequently Asked Questions
What causes the urban heat island effect?
Replacement of natural surfaces with asphalt, concrete, and dark roofs that absorb more solar radiation, combined with waste heat from vehicles, industry, and air conditioning.
How are urban heat island maps created?
They use satellite imagery with thermal sensors (e.g., Landsat, MODIS) that measure surface temperature. Data is processed in GIS software to generate heat maps.
What strategies can reduce urban heat islands?
Tree planting, creating parks, using green or reflective roofs (cool roofs), permeable and light-colored pavements, and regulations to reduce building heat emissions.
Direct URL
https://pub-c7d6a6ea828543ac903a74a341ccb2e1.r2.dev/imagens/urban-heat-island-map-documentary-photography-fresh14.avifHow to credit
Include a visible link back to UtilizAí. Copy one of the snippets below:
<a href="https://xn--utiliza-eza.com/en/midia/imagens/urban-heat-island-map-documentary-photography-fresh14">Urban heat island map</a> by <a href="https://xn--utiliza-eza.com">UtilizAí</a>, licensed under <a href="https://creativecommons.org/licenses/by/4.0/">CC BY 4.0</a>.
[Urban heat island map](https://xn--utiliza-eza.com/en/midia/imagens/urban-heat-island-map-documentary-photography-fresh14) by [UtilizAí](https://xn--utiliza-eza.com), CC BY 4.0
License: CC-BY-4.0