Urban heat island map
1344×768 · AVIF · CC BY 4.0
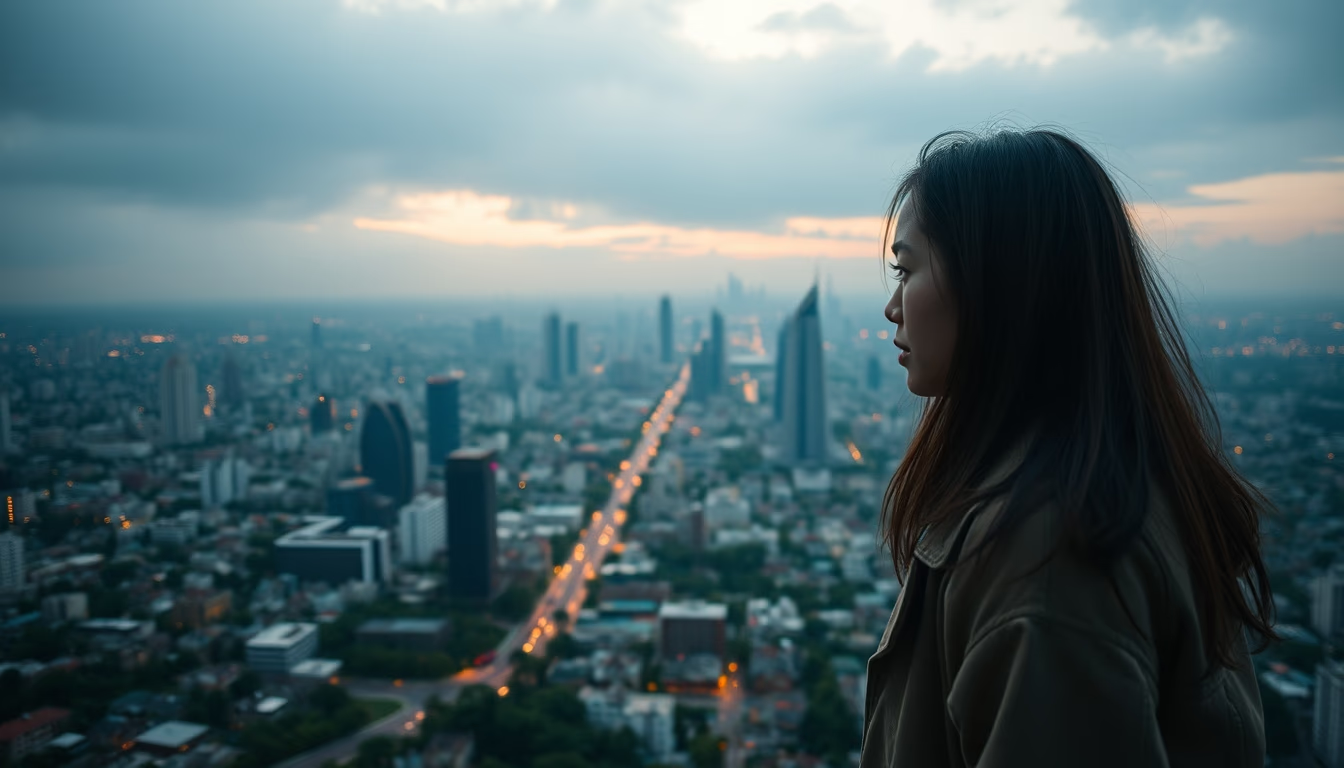
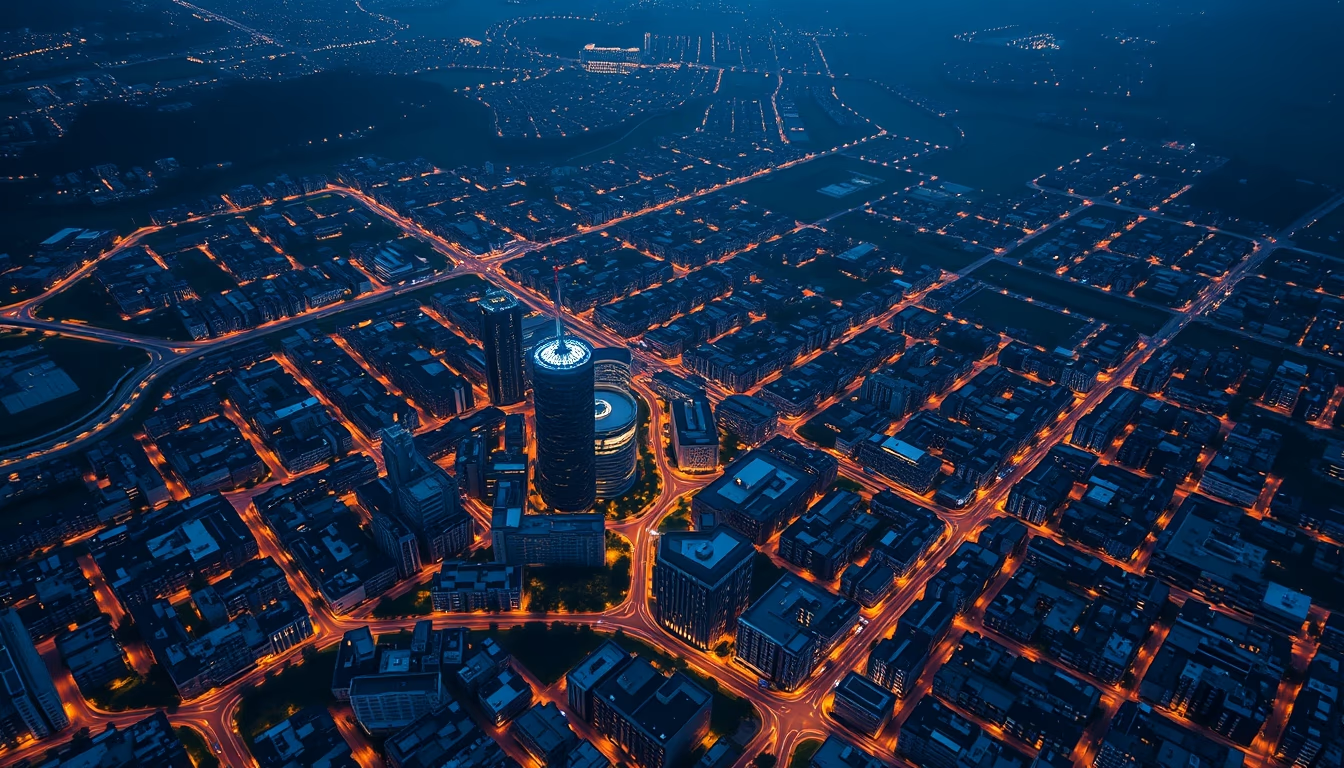
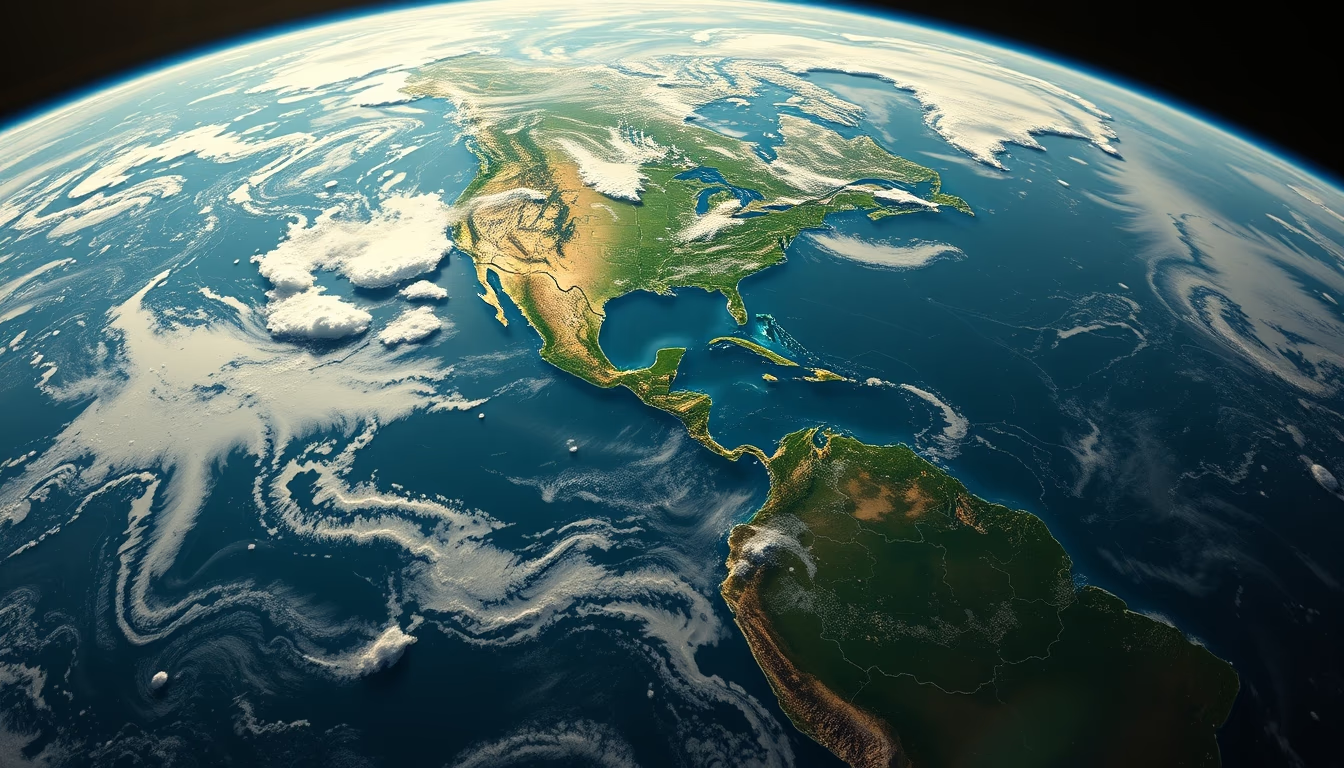
Urban heat island map reveals how cities retain more heat than rural areas, a phenomenon monitored by satellites.
About this subject
Urban heat islands are microclimates where densely built areas are significantly warmer than surrounding rural zones. This phenomenon arises because natural surfaces are replaced by asphalt, concrete and dark roofs, which absorb and re-emit solar radiation intensely. The lack of vegetation and water bodies reduces cooling through evapotranspiration, and human activities (vehicles, industries) add extra heat.
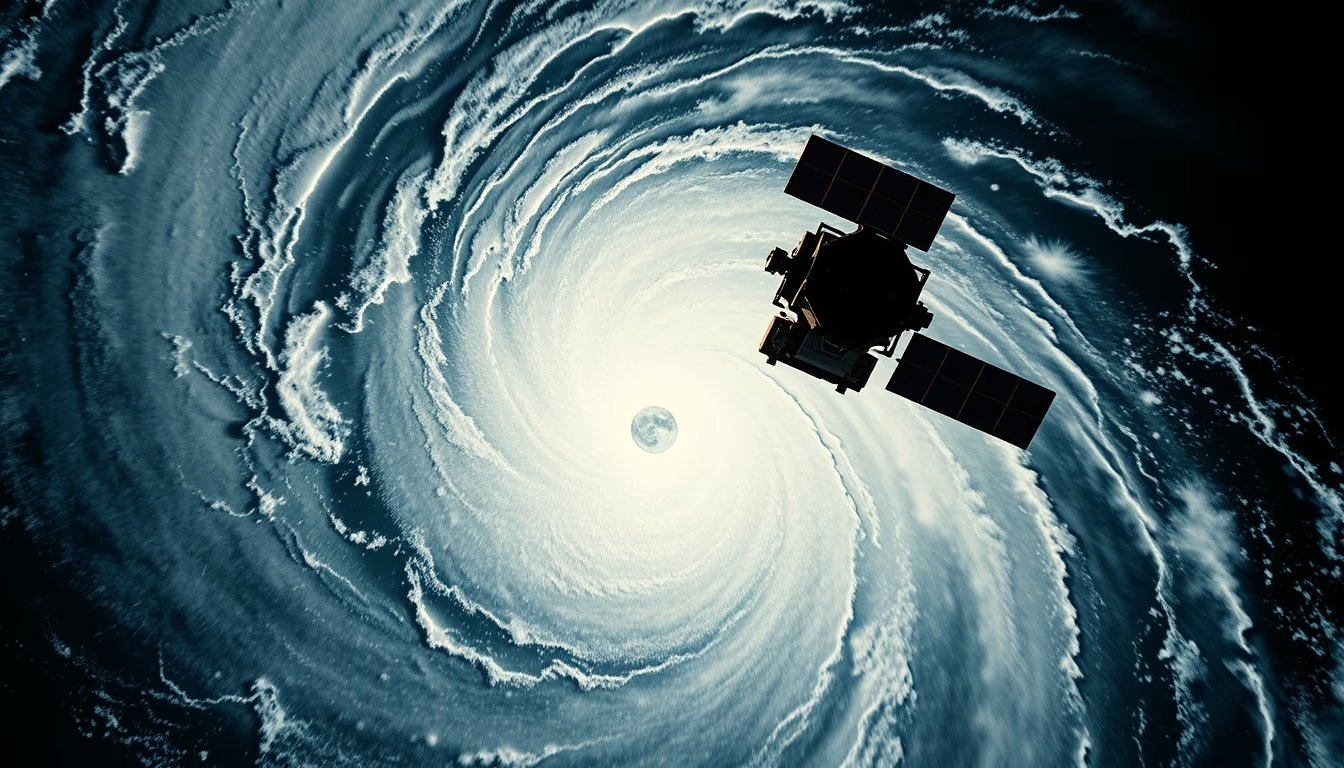
Satellites such as Landsat and ECOSTRESS (on the ISS) measure land surface temperature using infrared sensors, generating detailed maps that reveal intra-urban thermal variation. These data are essential for identifying heat hotspots, guiding tree-planting policies and requiring reflective materials in construction. Cities like São Paulo and Rio de Janeiro have recorded differences of up to 10°C between central districts and parks.
Impacts go beyond discomfort: heat islands increase energy consumption for air conditioning, worsen air pollution and raise the risk of respiratory and cardiovascular diseases. During heatwaves, the effect can be deadly for vulnerable populations. Solutions such as green roofs, permeable pavements and expanded green areas help mitigate the problem, with satellite modeling being a crucial tool for sustainable urban planning.
Frequently Asked Questions
What is an urban heat island?
It is a phenomenon where urban areas have higher temperatures than surrounding rural areas due to dark surfaces, lack of vegetation, and heat from human activities.
How do satellites detect urban heat islands?
Infrared sensors on satellites such as Landsat and ECOSTRESS measure thermal radiation emitted by the surface, producing temperature maps that show variations across neighborhoods.
What are the consequences of urban heat islands?
Increased energy consumption, worsened air quality, thermal discomfort, and health risks, especially during heatwaves. Urban planning with vegetation and reflective materials helps mitigate these impacts.
Direct URL
https://pub-c7d6a6ea828543ac903a74a341ccb2e1.r2.dev/imagens/urban-heat-island-map-documentary-nature-style-fresh3.avifHow to credit
Include a visible link back to UtilizAí. Copy one of the snippets below:
<a href="https://xn--utiliza-eza.com/en/midia/imagens/urban-heat-island-map-documentary-nature-style-fresh3">Urban heat island map</a> by <a href="https://xn--utiliza-eza.com">UtilizAí</a>, licensed under <a href="https://creativecommons.org/licenses/by/4.0/">CC BY 4.0</a>.
[Urban heat island map](https://xn--utiliza-eza.com/en/midia/imagens/urban-heat-island-map-documentary-nature-style-fresh3) by [UtilizAí](https://xn--utiliza-eza.com), CC BY 4.0
License: CC-BY-4.0