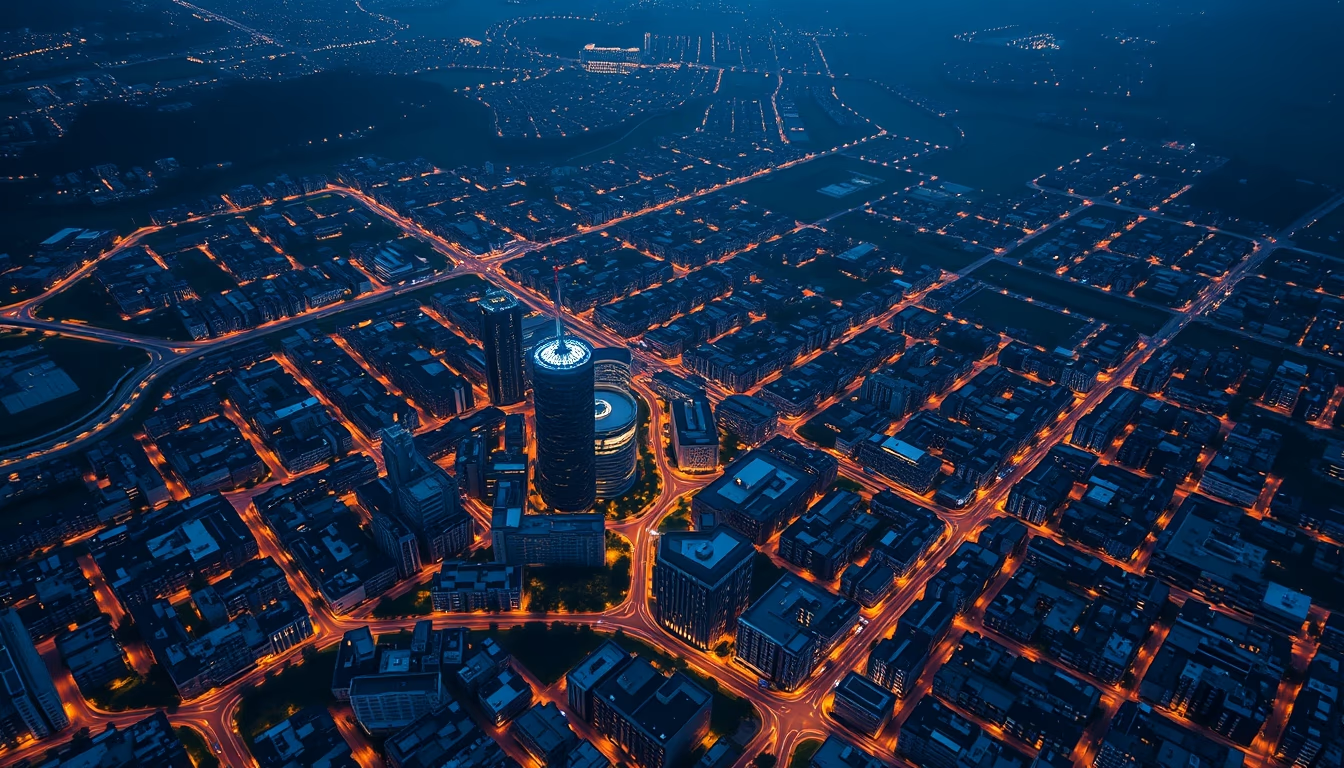
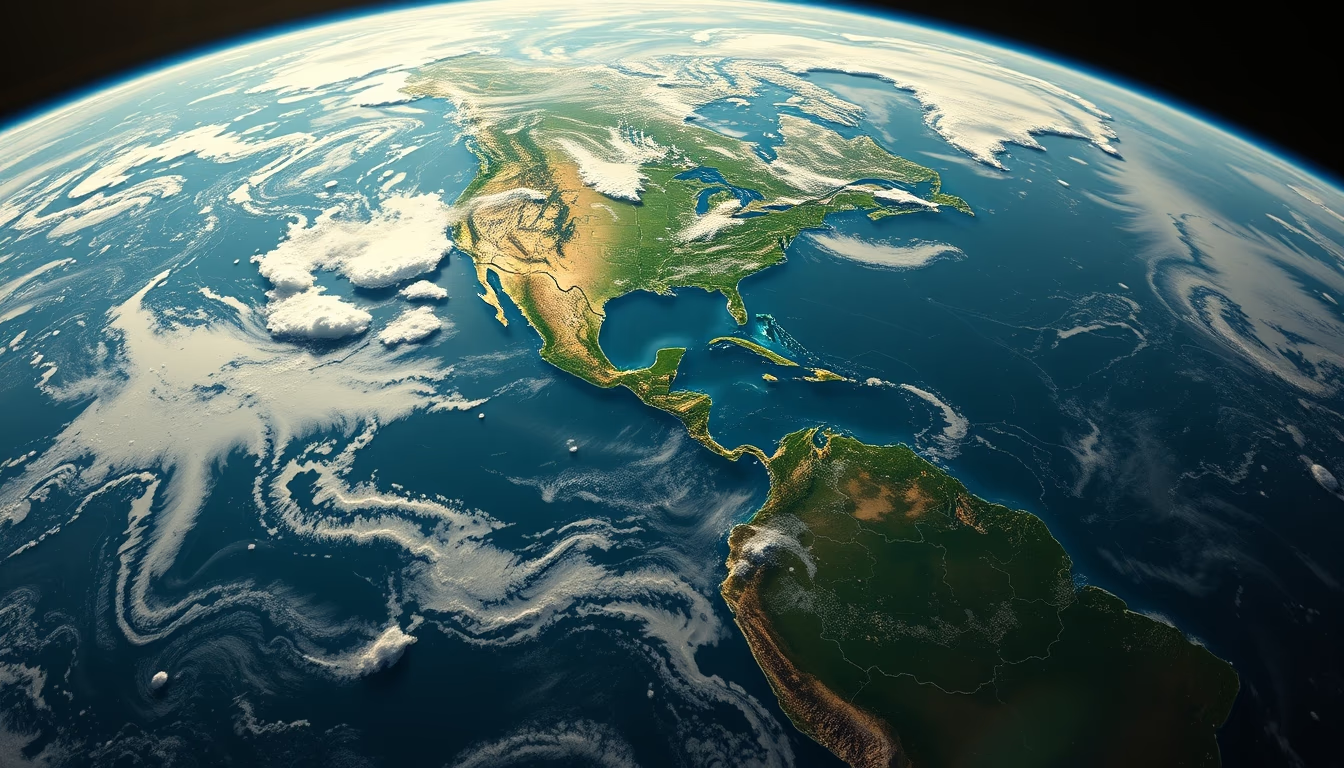
Urban heat island map
1344×768 · AVIF · CC BY 4.0
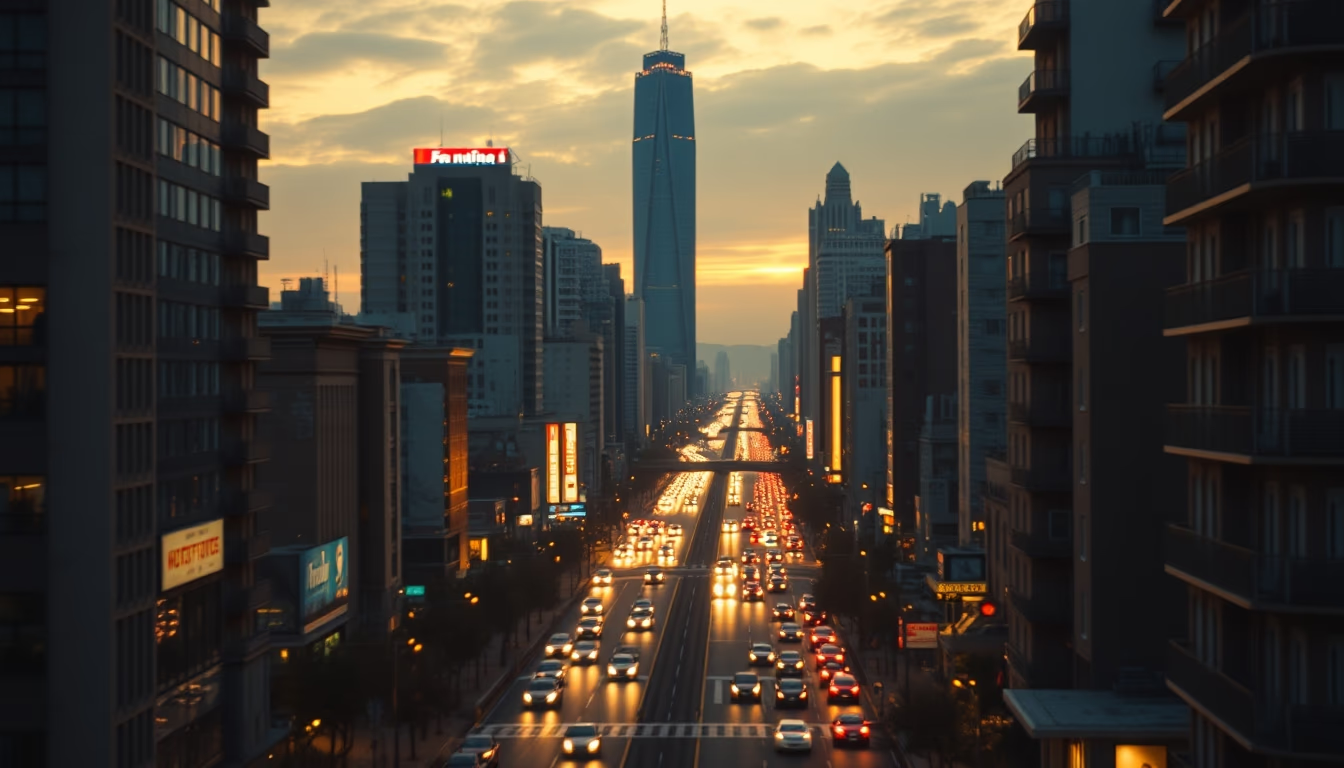
Urban heat island maps are generated from satellite data such as Landsat, revealing temperature differences between urban and rural areas.
About this subject
Urban heat islands (UHI) are a phenomenon where metropolitan areas experience higher temperatures than their surrounding rural regions. This effect is mainly caused by replacing natural surfaces with materials like concrete and asphalt, which absorb and retain heat, along with heat emissions from vehicles, industries, and air conditioning. Satellites such as Landsat (NASA/USGS) and MODIS (aboard Terra and Aqua) provide thermal imagery that enables mapping of land surface temperature, creating detailed UHI maps.
In Brazil, cities like São Paulo, Rio de Janeiro, and Belo Horizonte are classic UHI examples. Studies show that temperature differences between densely built urban centers and peripheral green areas can exceed 10°C during the day. The thermal map, typically displayed with a color scale (blue for cool areas to red for hot ones), helps urban planners identify critical points and implement mitigation strategies such as parks, green roofs, and reflective materials.
Interestingly, UHIs not only affect thermal comfort but also influence wind patterns, precipitation (increasing convective rainfall), and electricity demand. Global data compiled by orbital sensors indicate that nearly all cities with over 1 million inhabitants exhibit some degree of UHI. Heat island maps are essential tools for climate change adaptation policies, especially in tropical regions.
Frequently Asked Questions
What is an urban heat island?
An urban heat island is a phenomenon where urban areas experience higher temperatures than surrounding rural regions, due to the replacement of natural surfaces with heat-retaining materials and human activities.
How do satellites generate heat island maps?
Satellites like Landsat and MODIS have thermal infrared sensors that measure surface temperature. The data is processed into color-coded maps highlighting temperature differences between built-up and green areas.
Why are heat island maps important?
They assist urban planning in mitigating heat effects, improving thermal comfort, reducing energy consumption, and adapting cities to climate change.
Direct URL
https://pub-c7d6a6ea828543ac903a74a341ccb2e1.r2.dev/imagens/urban-heat-island-map-cinematic-wide-shot-fresh15.avifHow to credit
Include a visible link back to UtilizAí. Copy one of the snippets below:
<a href="https://xn--utiliza-eza.com/en/midia/imagens/urban-heat-island-map-cinematic-wide-shot-fresh15">Urban heat island map</a> by <a href="https://xn--utiliza-eza.com">UtilizAí</a>, licensed under <a href="https://creativecommons.org/licenses/by/4.0/">CC BY 4.0</a>.
[Urban heat island map](https://xn--utiliza-eza.com/en/midia/imagens/urban-heat-island-map-cinematic-wide-shot-fresh15) by [UtilizAí](https://xn--utiliza-eza.com), CC BY 4.0
License: CC-BY-4.0