Investment portfolio chart hologram
1344×768 · AVIF · CC BY 4.0
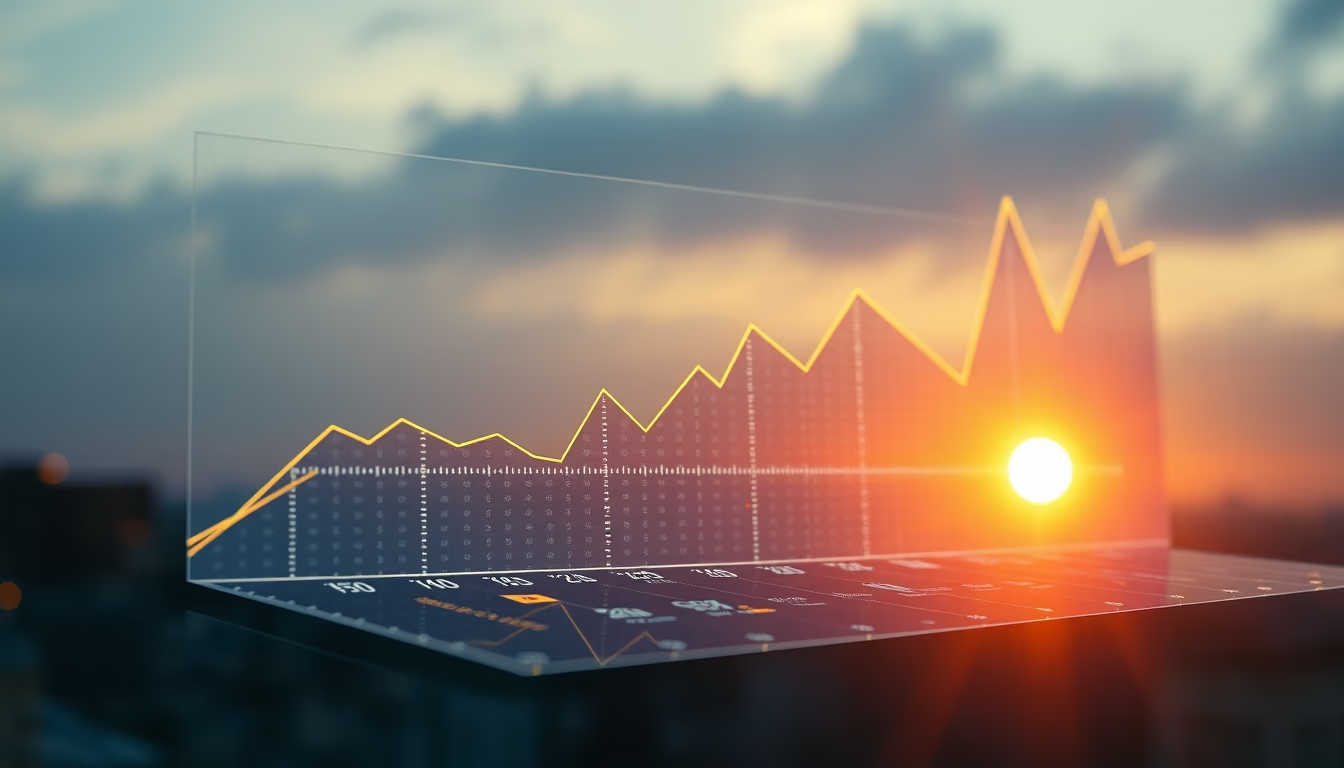
Hologram of an investment portfolio chart in a corporate setting, representing financial analysis and real-time data technology.
About this subject
Investment portfolio chart holograms are three-dimensional visual projections used in corporate and financial environments for real-time data analysis. This technology, based on holographic projection or augmented reality, allows investors and analysts to view complex metrics such as asset performance, capital allocation, and risks in an interactive and immersive way. In 2023, the global hologram and augmented reality market was valued at US$30.7 billion, with a projected annual growth of 25% until 2030, driven by sectors like finance, healthcare, and education.
In the financial context, these holograms replace traditional dashboards on flat screens, offering a more intuitive experience for detecting patterns and trends. Companies like Microsoft with HoloLens and fintech startups have adopted this technology in trading rooms and board meetings. Holographic visualization allows users to rotate, zoom, and filter data with gestures, facilitating quick decision-making in volatile markets. Additionally, integration with artificial intelligence enables real-time predictions, such as economic scenario simulations.
Historically, the concept of holograms emerged in the 1940s with physicist Dennis Gabor, but commercial application in finance is recent. In Brazil, use is still limited to large banks and consultancies, such as Itaú Unibanco, which tests mixed reality solutions for credit analysis. Despite potential, challenges like high cost (devices starting at US$3,500) and network infrastructure requirements limit mass adoption. Even so, experts predict that by 2025, 30% of large financial institutions will use holograms for investment reports.
Interestingly, data accuracy in holograms depends on reliable sources and constant updating, as outdated information can lead to wrong decisions. In 2022, the New York Stock Exchange (NYSE) held a public demonstration of a holographic panel to monitor indices, highlighting the trend of market digitalization. For individual investors, although still distant, the popularization of more affordable augmented reality glasses may democratize access to these tools in coming years.
Frequently Asked Questions
How does a portfolio chart hologram work?
It uses light projection or augmented reality to create an interactive 3D image. Sensors detect user gestures to manipulate data in real time.
Which companies use holograms for investments?
Large banks like JPMorgan and Itaú Unibanco, as well as fintechs and the NYSE, already test or use holograms in trading rooms and credit analysis.
Will holograms completely replace traditional dashboards?
Not entirely, but they will complement them. Adoption depends on cost, infrastructure, and training. The trend is for them to become common in large institutions by 2030.
Direct URL
https://pub-c7d6a6ea828543ac903a74a341ccb2e1.r2.dev/imagens/investment-portfolio-chart-hologram-cinematic-wide-shot-v2.avifHow to credit
Include a visible link back to UtilizAí. Copy one of the snippets below:
<a href="https://xn--utiliza-eza.com/en/midia/imagens/investment-portfolio-chart-hologram-cinematic-wide-shot-v2">Investment portfolio chart hologram</a> by <a href="https://xn--utiliza-eza.com">UtilizAí</a>, licensed under <a href="https://creativecommons.org/licenses/by/4.0/">CC BY 4.0</a>.
[Investment portfolio chart hologram](https://xn--utiliza-eza.com/en/midia/imagens/investment-portfolio-chart-hologram-cinematic-wide-shot-v2) by [UtilizAí](https://xn--utiliza-eza.com), CC BY 4.0
License: CC-BY-4.0





