Ethereum gas fees dashboard chart
1344×768 · AVIF · CC BY 4.0
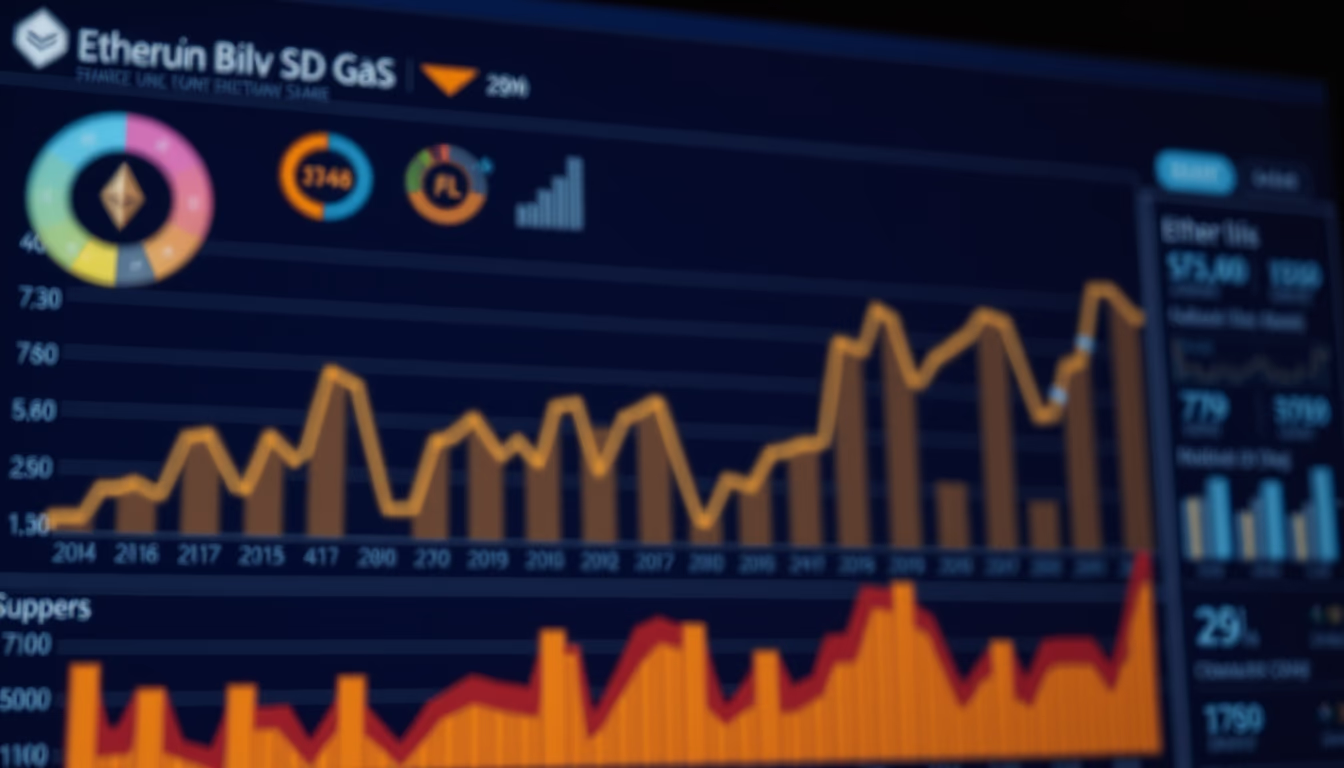
Interactive dashboard tracking Ethereum gas fees in real time, an essential tool for traders and developers.
About this subject
The Ethereum gas fees dashboard chart is an analytical panel displaying transaction costs on the Ethereum blockchain, measured in gwei. The term "gas" refers to the unit measuring the computational effort required to execute operations such as ETH transfers, smart contract interactions, or NFT minting. Each transaction requires a specific amount of gas, and the price per unit (gas price) fluctuates based on network demand. During usage peaks, such as popular NFT launches or high market volatility, fees can spike, making the dashboard a crucial tool for users aiming to optimize costs.
Built by platforms like Etherscan, Dune Analytics, or Glassnode, this dashboard typically features line or bar charts showing average, median, and percentile gas fees over time. Common indicators include the lowest gas price in the last 24 hours or comparisons across transaction types (simple, ERC-20, NFT). The visualization helps identify less congested periods, often during late nights or weekends when network activity decreases.
Beyond financial aspects, gas fees serve as a thermometer for Ethereum's health: very high fees indicate saturation and may signal the need for scalability solutions like rollups (Optimism, Arbitrum) or the migration to Ethereum 2.0 with proof-of-stake. For developers, monitoring gas is vital for estimating contract deployment costs and optimizing code to reduce gas consumption and thus fees for end users.
Interestingly, the term "gas" was inspired by fuel: without it, a transaction won't "move." EIP-1559, implemented in August 2021, reformed pricing by introducing a base fee that is burned (reducing ETH supply) and a tip for validators. This mechanism brought more predictability, but fluctuations remain common. Modern dashboards also display the amount of ETH burned, linking gas fees to the network's deflationary monetary policy.
Frequently Asked Questions
What is gwei and how does it relate to gas fees?
Gwei is a unit of ether (ETH), equal to 10⁻⁹ ETH. Gas fees are quoted in gwei to make small values easier to read. For example, a fee of 50 gwei means 0.00000005 ETH per unit of gas.
How can I use a gas fee dashboard to save on transactions?
Monitor periods of low activity, such as late nights and weekends. Set alerts for when the gas price drops below your target. Tools like Etherscan and Gas Now provide recommendations for low, average, and high fees.
What does ETH burning in gas fees mean?
Since EIP-1559, part of the fee (base fee) is burned, permanently removed from circulation. This can make ETH deflationary if the burned amount exceeds new token issuance, impacting market value.
Direct URL
https://pub-c7d6a6ea828543ac903a74a341ccb2e1.r2.dev/imagens/ethereum-gas-fees-dashboard-chart-studio-editorial-portrait-v3.avifHow to credit
Include a visible link back to UtilizAí. Copy one of the snippets below:
<a href="https://xn--utiliza-eza.com/en/midia/imagens/ethereum-gas-fees-dashboard-chart-studio-editorial-portrait-v3">Ethereum gas fees dashboard chart</a> by <a href="https://xn--utiliza-eza.com">UtilizAí</a>, licensed under <a href="https://creativecommons.org/licenses/by/4.0/">CC BY 4.0</a>.
[Ethereum gas fees dashboard chart](https://xn--utiliza-eza.com/en/midia/imagens/ethereum-gas-fees-dashboard-chart-studio-editorial-portrait-v3) by [UtilizAí](https://xn--utiliza-eza.com), CC BY 4.0
License: CC-BY-4.0