Decentralized app dashboard showing yield farming positions
1344×768 · AVIF · CC BY 4.0
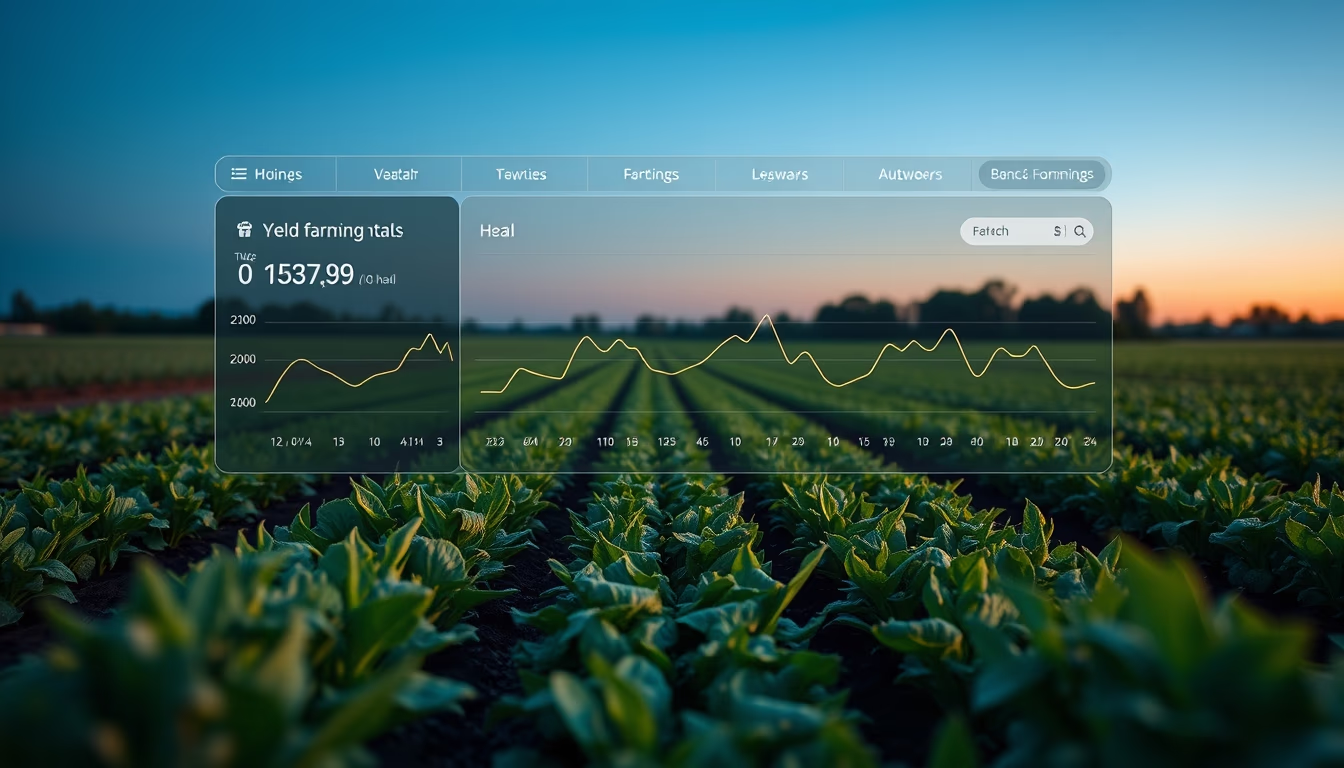
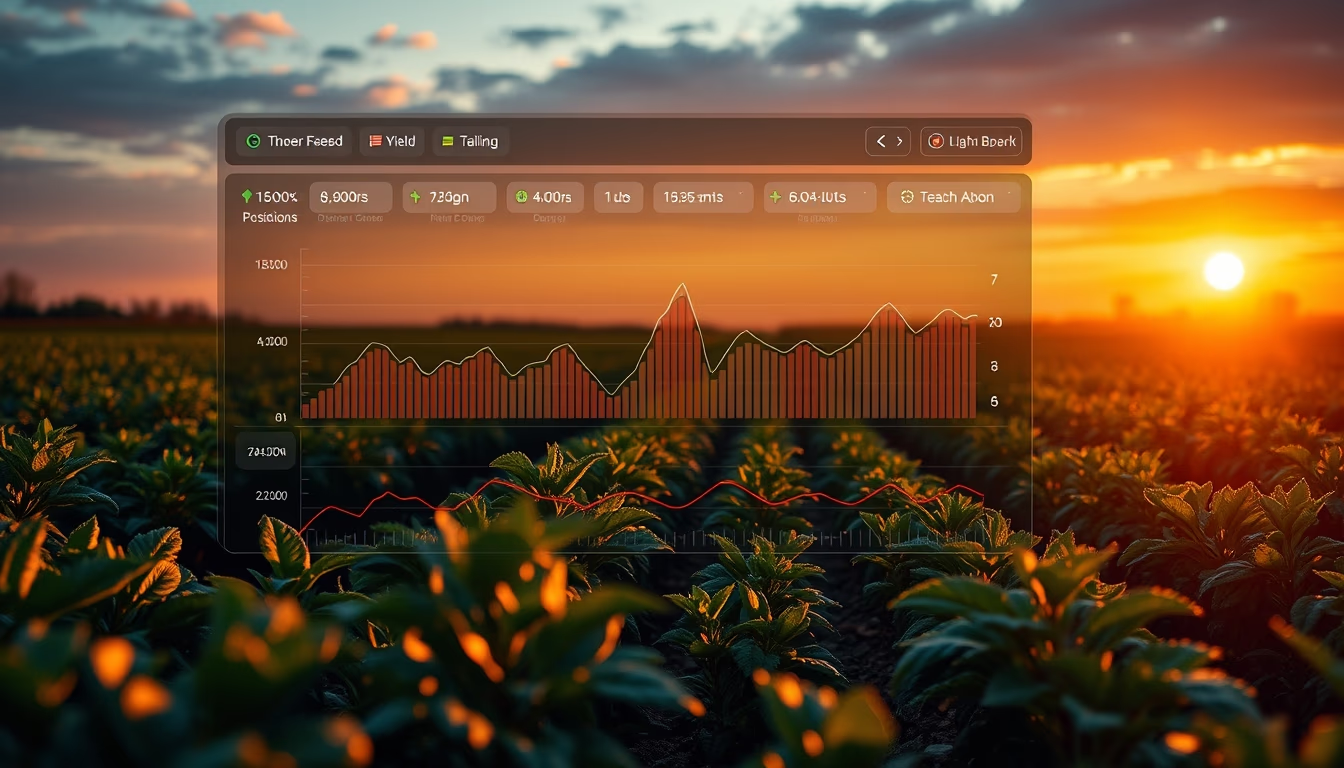
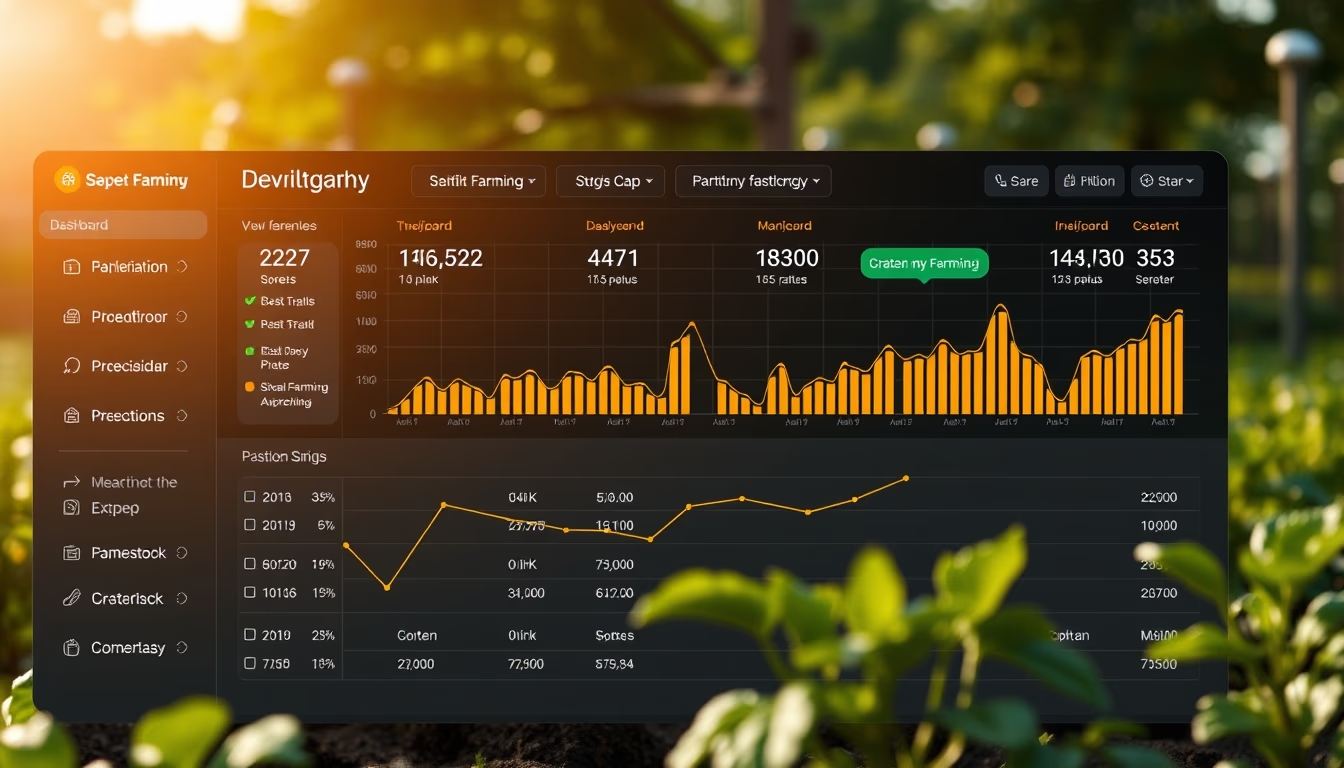
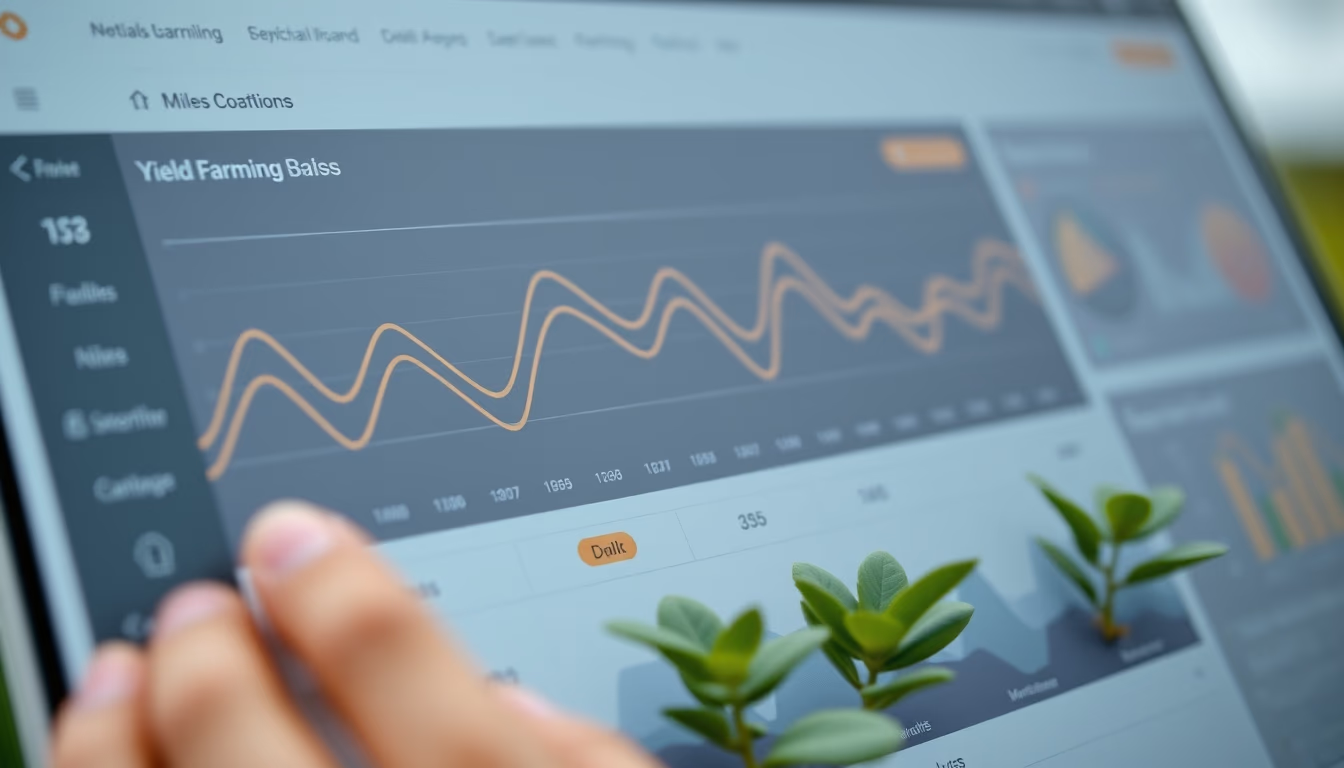
Decentralized app dashboard displaying yield farming positions with liquidity and profitability metrics.
About this subject
Yield farming is a core practice in the DeFi (Decentralized Finance) ecosystem, where users provide liquidity to protocols in exchange for rewards, usually in native tokens. The dashboard of a decentralized dapp, as shown, consolidates crucial information for the yield farmer: total balance, dollar value, accrued fees, APY (annual percentage yield), and allocation across different liquidity pools. These dashboards are essential for monitoring positions in real time, especially on chains like Ethereum, BNB Chain, or Polygon, where volatility and transaction fees can significantly impact profits.
The interface reflects the minimalist, data-driven design trend common in dapps such as Uniswap, Curve, or Yearn Finance. The displayed metrics allow users to make quick decisions about reallocating funds, withdrawing liquidity, or reinvesting rewards. The presence of historical performance charts and risk indicators, such as IL (impermanent loss), is frequent in advanced tools. Yield farming, while profitable, involves risks like smart contract hacks, rug pulls, and price fluctuations of deposited assets.
The image captures the moment known as "twilight blue hour," a period of soft lighting that may symbolize the transition between market cycles - bull and bear. The symmetric composition of the dashboard suggests balance and organization, values sought by investors managing multiple positions. Anomalies detected in such dashboards can indicate arbitrage opportunities or liquidity issues, requiring immediate attention. Blockchain technology ensures transparency, but dashboard usability is key for mass DeFi adoption.
Frequently Asked Questions
What is yield farming?
Yield farming is the practice of providing liquidity to DeFi protocols to earn rewards, usually in tokens. Users deposit asset pairs into liquidity pools and receive trading fees and/or governance tokens.
Which metrics are most important on a yield farming dashboard?
APY (annual percentage yield), total value locked (TVL), accumulated fees, dollar balance, and impermanent loss exposure are critical metrics for assessing profitability and risk.
What does 'anomaly detected' mean on a DeFi dashboard?
It indicates the system identified unusual behavior, such as sudden APY changes, liquidity drops, or atypical price movements, which may signal opportunities or risks.
Direct URL
https://pub-c7d6a6ea828543ac903a74a341ccb2e1.r2.dev/imagens/decentralized-app-dashboard-showing-yield-farming-positions-symmetric-composition-twilight-blue-hour.avifHow to credit
Include a visible link back to UtilizAí. Copy one of the snippets below:
<a href="https://xn--utiliza-eza.com/en/midia/imagens/decentralized-app-dashboard-showing-yield-farming-positions-symmetric-composition-twilight-blue-hour">Decentralized app dashboard showing yield farming positions</a> by <a href="https://xn--utiliza-eza.com">UtilizAí</a>, licensed under <a href="https://creativecommons.org/licenses/by/4.0/">CC BY 4.0</a>.
[Decentralized app dashboard showing yield farming positions](https://xn--utiliza-eza.com/en/midia/imagens/decentralized-app-dashboard-showing-yield-farming-positions-symmetric-composition-twilight-blue-hour) by [UtilizAí](https://xn--utiliza-eza.com), CC BY 4.0
License: CC-BY-4.0
Tags
Related images
 Decentralized app dashboard showing yield farming positions
 Decentralized app dashboard showing yield farming positions
 Decentralized app dashboard showing yield farming positions
 Decentralized app dashboard showing yield farming positions
 Decentralized app dashboard showing yield farming positions
 Decentralized app dashboard showing yield farming positions