Crypto exchange UI on smartphone showing trading pair
1344×768 · AVIF · CC BY 4.0
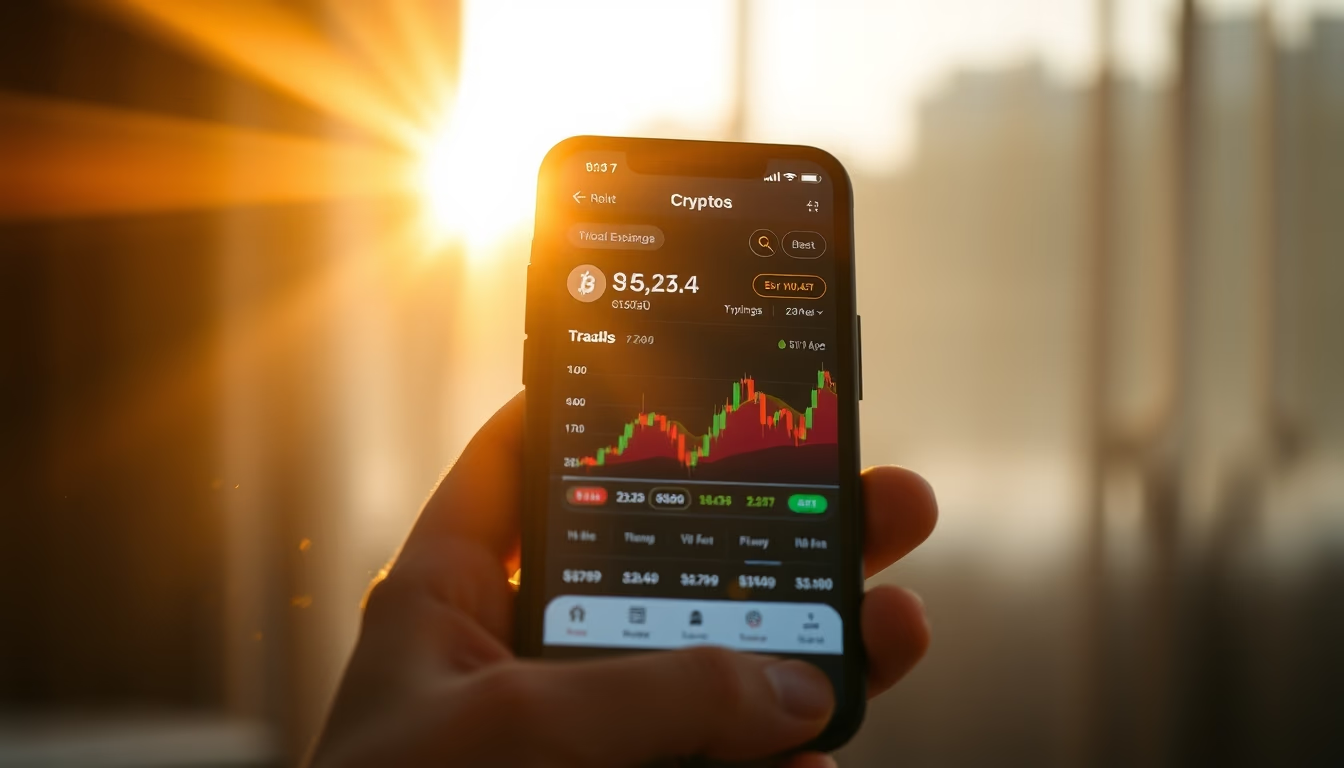
Cryptocurrency exchange interface on a smartphone displays the BTC/USDT trading pair with candlestick chart and order book.
About this subject
The interface of a cryptocurrency exchange, such as Binance, Kraken, or Mercado Bitcoin, is designed to allow traders to buy, sell, and monitor digital asset pairs in real time. At the center of the screen, the BTC/USDT trading pair (Bitcoin against Tether) displays the current price, 24-hour percentage change, and trading volume. Below, a candlestick chart shows price action over selectable intervals like 1 minute, 1 hour, or 1 day. Green candles indicate price increases, while red candles indicate decreases, enabling quick technical analysis.
Next to the chart, the order book lists buy (bids) and sell (asks) orders with their respective volumes, showing market depth. Traders use this information to identify support and resistance levels. The interface also includes an order panel where limit, market, or stop-loss orders can be placed. Many exchanges offer leverage, which amplifies both gains and losses, and trading modes such as spot, futures, and margin.
In Brazil, exchanges like Mercado Bitcoin and Foxbit are popular, but experienced traders often use international platforms like Binance and Bybit for greater liquidity and variety of pairs. Mobile trading has grown with the popularity of smartphone apps, which offer push notifications and biometric authentication for security. However, crypto market volatility demands caution: in 2021, Bitcoin reached $69,000 and later dropped to $30,000, showing significant risks. The interface depicted here, on an overcast day, symbolizes the market's constant activity, operating 24/7.
Frequently Asked Questions
What is a trading pair in cryptocurrencies?
A trading pair is the combination of two cryptocurrencies that can be exchanged for each other, such as BTC/USDT. The price indicates how much of the base currency (USDT) is needed to buy the quote currency (BTC).
How does the candlestick chart work on exchanges?
Each candlestick represents a time period and shows four prices: open, close, high, and low. A green candle means close higher than open (bullish); a red candle means close lower (bearish).
What are the risks of trading cryptocurrencies on a smartphone?
Risks include extreme volatility, potential losses from leverage, phishing attacks, and device theft. It is essential to use two-factor authentication and keep the app updated.
Direct URL
https://pub-c7d6a6ea828543ac903a74a341ccb2e1.r2.dev/imagens/crypto-exchange-ui-on-smartphone-showing-trading-pair-editorial-overcast-daytime-4.avifHow to credit
Include a visible link back to UtilizAí. Copy one of the snippets below:
<a href="https://xn--utiliza-eza.com/en/midia/imagens/crypto-exchange-ui-on-smartphone-showing-trading-pair-editorial-overcast-daytime-4">Crypto exchange UI on smartphone showing trading pair</a> by <a href="https://xn--utiliza-eza.com">UtilizAí</a>, licensed under <a href="https://creativecommons.org/licenses/by/4.0/">CC BY 4.0</a>.
[Crypto exchange UI on smartphone showing trading pair](https://xn--utiliza-eza.com/en/midia/imagens/crypto-exchange-ui-on-smartphone-showing-trading-pair-editorial-overcast-daytime-4) by [UtilizAí](https://xn--utiliza-eza.com), CC BY 4.0
License: CC-BY-4.0