Oscilloscope display waveform
1344×768 · AVIF · CC BY 4.0
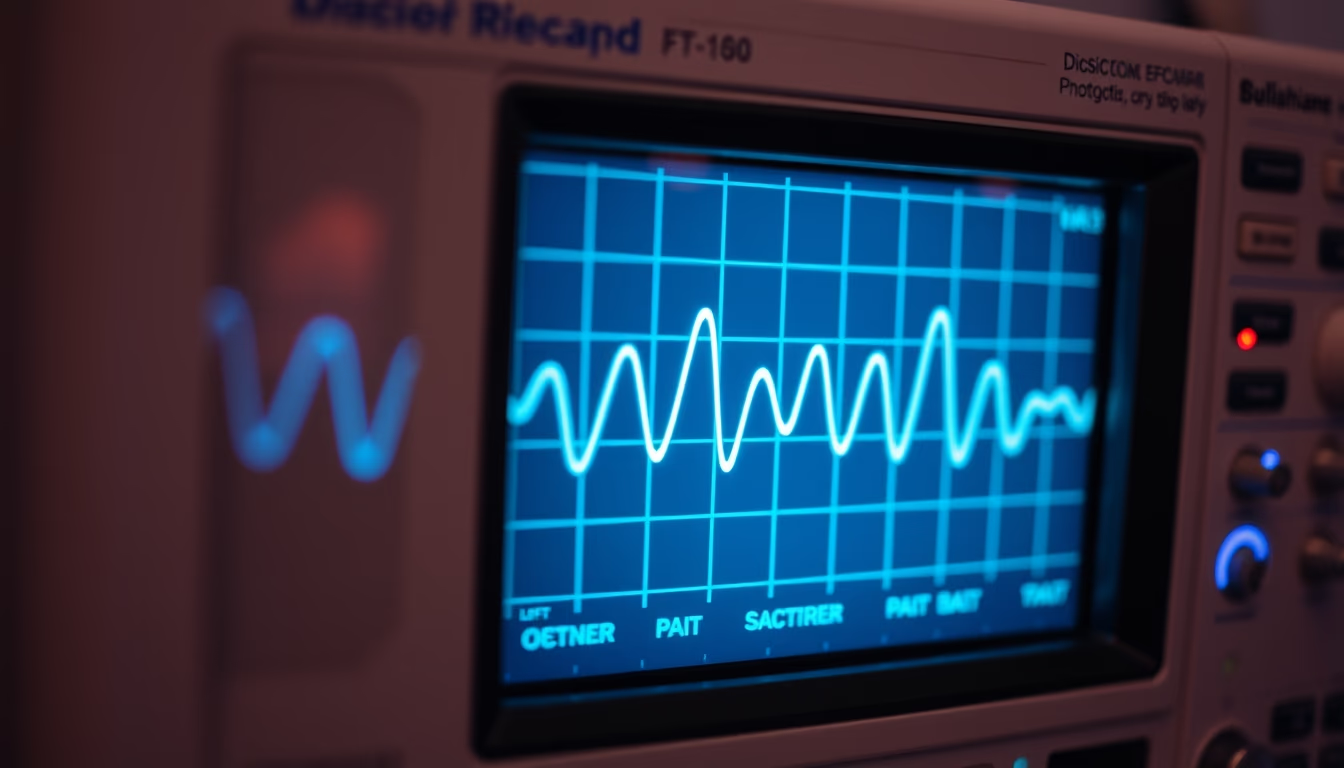
The oscilloscope displays electrical waveforms, an essential tool for engineers and technicians to analyze signals in real time.
About this subject
An oscilloscope is an electronic measurement instrument that graphically displays varying electrical signals over time. Its screen shows a waveform, with the horizontal axis (X) representing time and the vertical axis (Y) representing voltage. This visualization allows observation of characteristics such as amplitude, frequency, period, and signal distortion. Invented by Karl Ferdinand Braun in 1897, the oscilloscope evolved from cathode-ray tubes to modern digital models with storage and advanced analysis.
In practice, the oscilloscope is indispensable in electronics labs, equipment maintenance, and circuit development. It can capture sine, square, triangle, pulse, and complex signals like modulations. By adjusting the time base and voltage scale, users can observe from low-frequency audio signals to radio frequency signals in the gigahertz range. Modern oscilloscopes include functions such as trigger to stabilize the image, automatic parameter measurements, and USB interface for data transfer.
A curiosity: the term "oscilloscope" comes from Latin "oscillare" (to oscillate) and Greek "skopein" (to observe). Before digital models, analog oscilloscopes used an electron beam hitting a phosphorescent screen, creating classic green or blue traces. The displayed waveform can be affected by probe impedance and the instrument's bandwidth. In audio applications, oscilloscopes visualize musical waveforms and check signal symmetry. In telecommunications, they aid in analyzing digital pulses and detecting interference.
Frequently Asked Questions
What is an oscilloscope and what is it used for?
An oscilloscope is an instrument that displays waveforms of electrical signals, allowing measurement of voltage, frequency, period, and distortion. It is used in electronics, maintenance, and research to diagnose circuits and analyze signals.
How to interpret a waveform on an oscilloscope?
The horizontal axis shows time, the vertical axis voltage. The waveform height indicates amplitude, the distance between consecutive peaks indicates the period (inverse of frequency). Shapes like sine, square, or triangular reveal signal characteristics.
What is the difference between analog and digital oscilloscopes?
The analog uses a cathode-ray tube and displays the waveform in real time continuously. The digital converts the signal into data, allowing storage, zoom, automatic measurements, and greater bandwidth with advanced analysis.
Direct URL
https://pub-c7d6a6ea828543ac903a74a341ccb2e1.r2.dev/imagens/oscilloscope-display-waveform-lo-fi-disposable-camera-p1.avifHow to credit
Include a visible link back to UtilizAí. Copy one of the snippets below:
<a href="https://xn--utiliza-eza.com/en/midia/imagens/oscilloscope-display-waveform-lo-fi-disposable-camera-p1">Oscilloscope display waveform</a> by <a href="https://xn--utiliza-eza.com">UtilizAí</a>, licensed under <a href="https://creativecommons.org/licenses/by/4.0/">CC BY 4.0</a>.
[Oscilloscope display waveform](https://xn--utiliza-eza.com/en/midia/imagens/oscilloscope-display-waveform-lo-fi-disposable-camera-p1) by [UtilizAí](https://xn--utiliza-eza.com), CC BY 4.0
License: CC-BY-4.0