Oscilloscope display waveform
1344×768 · AVIF · CC BY 4.0
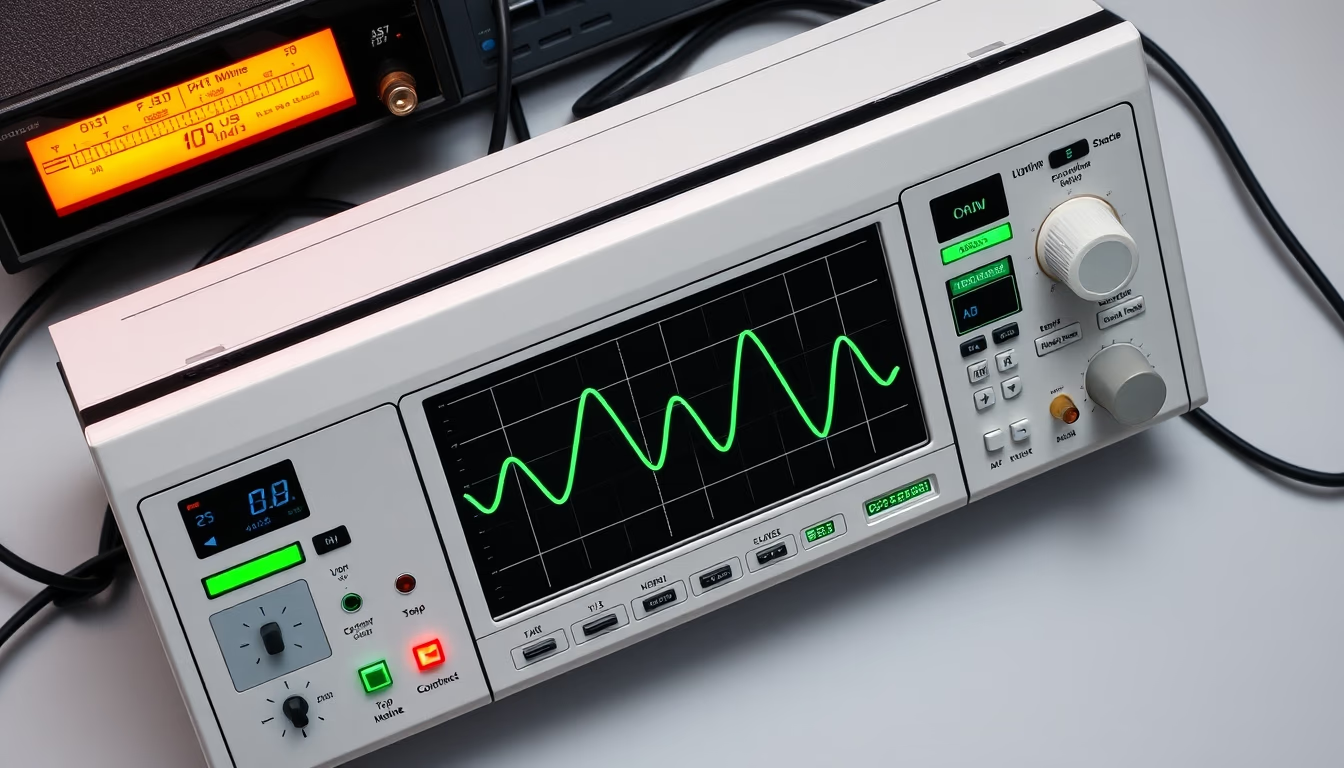
Oscilloscope displays a waveform on its screen, enabling detailed real-time analysis of electrical signals.
About this subject
An oscilloscope is an electronic test instrument that graphically displays varying electrical signals over time. The horizontal axis (X) represents time, while the vertical axis (Y) shows voltage. The displayed waveform reveals characteristics such as amplitude, frequency, period, and signal distortions. This equipment is essential in electronics labs, engineering, and maintenance, used for diagnosing circuits, checking sensor signals, and testing communication systems.
The operating principle is based on deflecting an electron beam across a phosphorescent screen. Modern digital oscilloscopes convert analog signals to digital, enabling storage, advanced analysis, and precise measurements. The oscilloscope's bandwidth determines the maximum frequency that can be accurately measured. For example, for 100 MHz signals, an oscilloscope with at least 500 MHz bandwidth is recommended.
Historically, the oscilloscope evolved from the cathode-ray tube (CRT), invented by Ferdinand Braun in the late 19th century. During World War II, its use in radar and telecommunications drove further development. Today, portable and benchtop oscilloscopes are widely used in education, research, and industry. The ability to visualize waveforms helps identify issues such as noise, interference, voltage spikes, and timing errors, making it an indispensable tool for electronics professionals.
Frequently Asked Questions
What does oscilloscope bandwidth mean?
Bandwidth indicates the range of frequencies the oscilloscope can accurately measure, usually specified in hertz (Hz). To avoid errors, the bandwidth should be at least five times the signal frequency being measured.
What is the difference between analog and digital oscilloscopes?
Analog oscilloscopes use a cathode-ray tube to display the signal directly, while digital ones convert the signal into digital data for processing and storage. Digital scopes offer advanced triggering, automatic measurements, and waveform storage capabilities.
How do I interpret a waveform displayed on an oscilloscope?
Observe the amplitude (peak-to-peak voltage), period (time between cycles), and waveform shape. Comparing with the expected shape helps identify distortions, noise, or faults. Adjust time and voltage scales for clear visualization.
Direct URL
https://pub-c7d6a6ea828543ac903a74a341ccb2e1.r2.dev/imagens/oscilloscope-display-waveform-isometric-flat-lay-p4.avifHow to credit
Include a visible link back to UtilizAí. Copy one of the snippets below:
<a href="https://xn--utiliza-eza.com/en/midia/imagens/oscilloscope-display-waveform-isometric-flat-lay-p4">Oscilloscope display waveform</a> by <a href="https://xn--utiliza-eza.com">UtilizAí</a>, licensed under <a href="https://creativecommons.org/licenses/by/4.0/">CC BY 4.0</a>.
[Oscilloscope display waveform](https://xn--utiliza-eza.com/en/midia/imagens/oscilloscope-display-waveform-isometric-flat-lay-p4) by [UtilizAí](https://xn--utiliza-eza.com), CC BY 4.0
License: CC-BY-4.0