Liquidity pool diagram two tokens swapping in AMM visualization
1344×768 · AVIF · CC BY 4.0
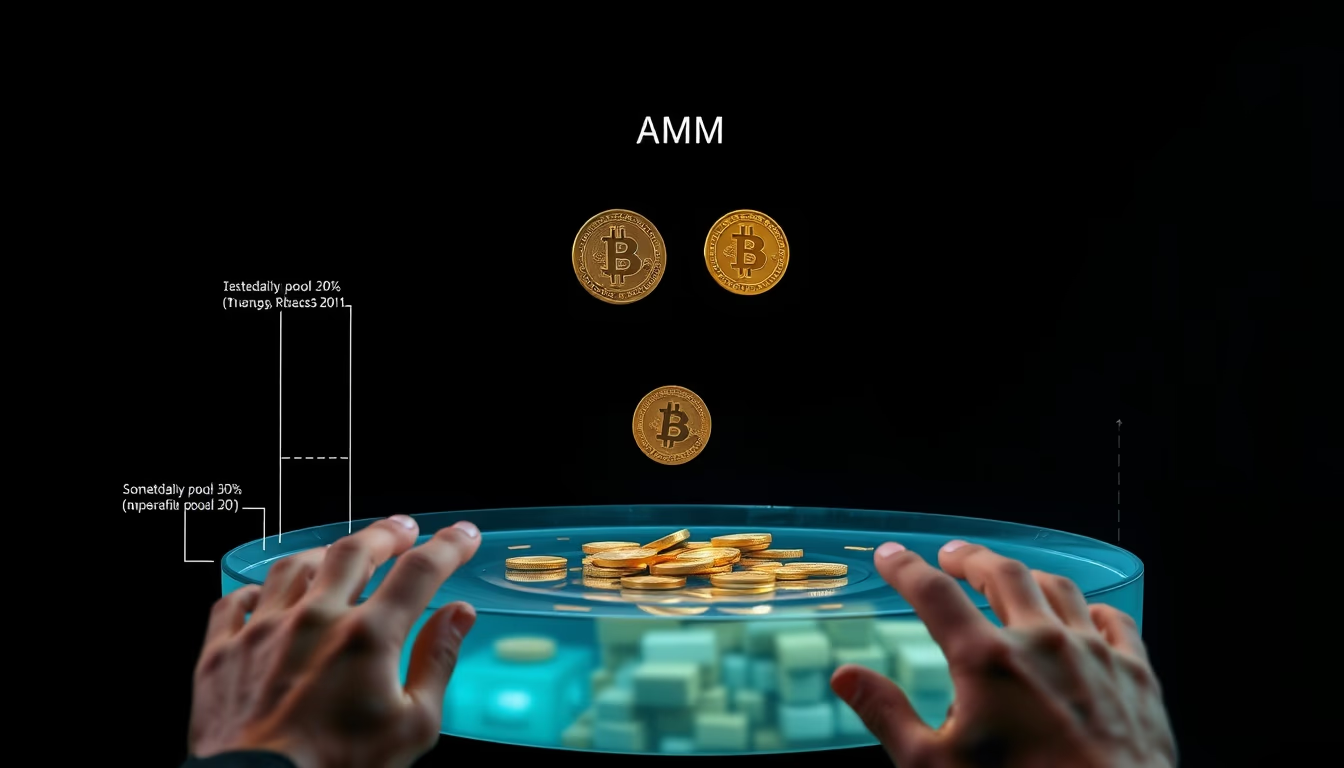
Technical diagram of a liquidity pool in an AMM, illustrating the swap between two tokens in a DeFi protocol.
About this subject
Automated Market Makers (AMMs) revolutionized crypto trading by replacing traditional order books with liquidity pools. In an AMM, such as those used by Uniswap, SushiSwap, or PancakeSwap, liquidity providers deposit pairs of tokens in equal value proportions, forming a pool. When a user performs a swap, for example exchanging Token A for Token B, the operation alters the pool's reserves and the price is determined by a constant mathematical formula, such as x * y = k. This model ensures continuous liquidity even for low-volume trading pairs, without relying on a direct counterparty (order book).
The diagram in question visually represents this mechanism: two tokens (represented by distinct colors) flow in opposite directions within a pool, symbolizing the exchange. The price curve, often depicted as a hyperbola, is a central element, showing how the reserve ratio determines the exchange rate. This type of visualization is essential for educating new users about how DEXs (decentralized exchanges) work and for developers seeking to optimize liquidity provision strategies.
Interestingly, the AMM concept was initially proposed by Vitalik Buterin in 2016 and popularized by Uniswap in 2018. Since then, the model has evolved to include variations such as pools with dynamic fees, multi-token pools (like Balancer), and integrations with traditional finance via stablecoins. Capital efficiency, however, remains a challenge: pools can suffer from impermanent loss, a phenomenon where liquidity providers lose value relative to simply holding the tokens. Diagrams like this help explain these risks intuitively.
In terms of application, liquidity pools are the backbone of lending protocols, yield farming, and even decentralized derivatives. AMM swap visualizations are also used in analytics dashboards, such as DexScreener and CoinGecko, to monitor real-time activity. With the growth of DeFi, understanding these diagrams has become fundamental for any ecosystem participant, from traders to smart contract developers.
Frequently Asked Questions
What is a liquidity pool in an AMM?
It is a collection of funds locked in a smart contract that provides liquidity for decentralized trading. Providers deposit two tokens in equal value proportions, allowing users to swap between them without the need for an order book.
How does the formula x * y = k determine the price?
The formula keeps the product of reserves constant. When one token is bought, its reserve decreases and the other increases, changing the price according to the new ratio. This ensures infinite liquidity but with price impact (slippage) for large orders.
What is impermanent loss?
It is the temporary loss of value that liquidity providers may suffer when the price of tokens in the pool deviates from the external price. It becomes permanent if the provider withdraws liquidity at that moment. It can be mitigated by trading fees or hedging strategies.
Direct URL
https://pub-c7d6a6ea828543ac903a74a341ccb2e1.r2.dev/imagens/liquidity-pool-diagram-two-tokens-swapping-in-amm-visualization-editorial-portrait-studio-professional-lighting.avifHow to credit
Include a visible link back to UtilizAí. Copy one of the snippets below:
<a href="https://xn--utiliza-eza.com/en/midia/imagens/liquidity-pool-diagram-two-tokens-swapping-in-amm-visualization-editorial-portrait-studio-professional-lighting">Liquidity pool diagram two tokens swapping in AMM visualization</a> by <a href="https://xn--utiliza-eza.com">UtilizAí</a>, licensed under <a href="https://creativecommons.org/licenses/by/4.0/">CC BY 4.0</a>.
[Liquidity pool diagram two tokens swapping in AMM visualization](https://xn--utiliza-eza.com/en/midia/imagens/liquidity-pool-diagram-two-tokens-swapping-in-amm-visualization-editorial-portrait-studio-professional-lighting) by [UtilizAí](https://xn--utiliza-eza.com), CC BY 4.0
License: CC-BY-4.0
Tags
Related images
 Stablecoin minting interface showing collateralization ratio
 Stablecoin minting interface showing collateralization ratio
 Stablecoin minting interface showing collateralization ratio
 Stablecoin minting interface showing collateralization ratio
 Stablecoin minting interface showing collateralization ratio
 Stablecoin minting interface showing collateralization ratio