DeFi yield aggregator dashboard showing APY rates across protocols
1344×768 · AVIF · CC BY 4.0
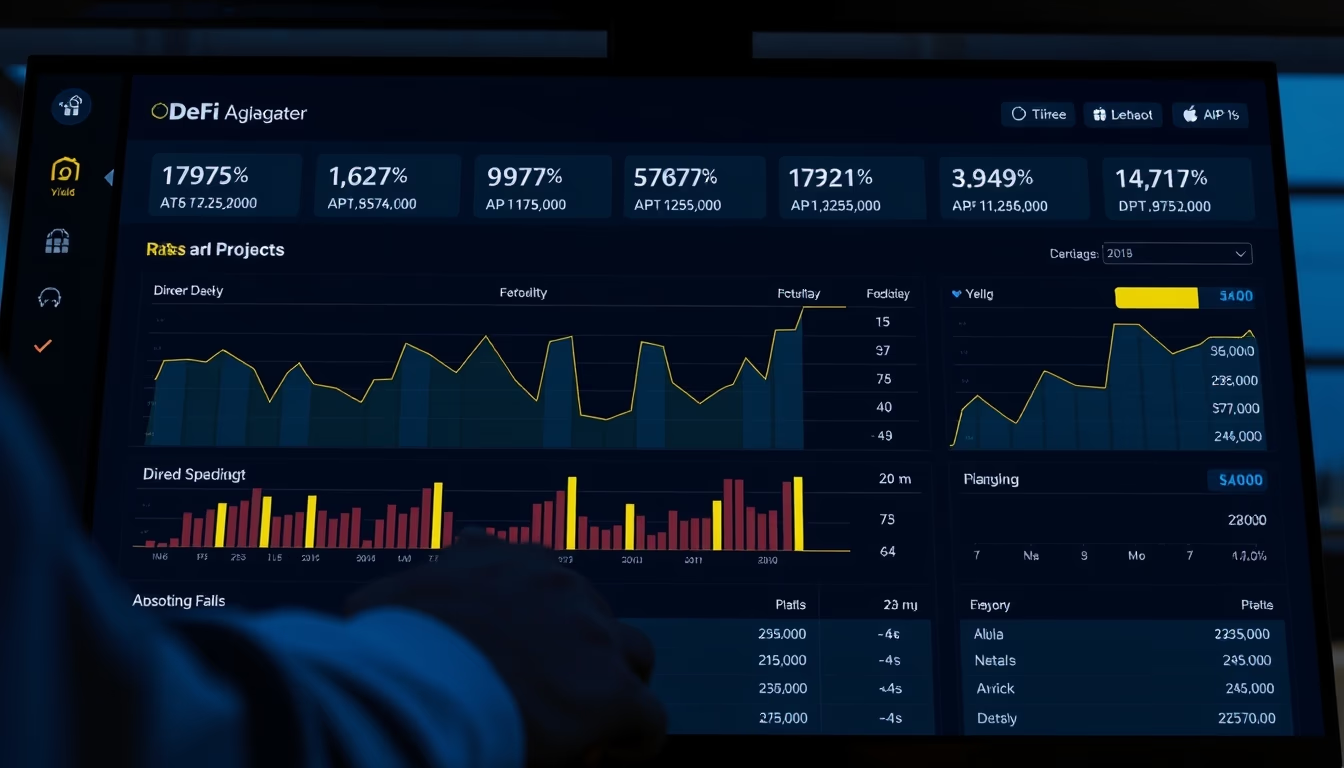
DeFi yield aggregator dashboards display real-time APY rates across protocols, enabling comparison and return optimization.
About this subject
Yield aggregators are platforms that automate the search for best returns in decentralized finance (DeFi). They monitor multiple protocols, such as Aave, Compound, and Curve, and display updated annual percentage yields (APY) on a dashboard. The goal is to maximize returns on deposited crypto assets, sparing users from manually checking each protocol.
These dashboards typically show metrics like current APY, historical rates, total value locked (TVL), and associated risks per pool. Some aggregators, like Yearn Finance and Beefy Finance, also execute automated compounding strategies to boost effective APY. Real-time visualization is critical as rates fluctuate constantly based on lending supply and demand.
The concept of yield farming gained traction around 2020 with the DeFi boom. Aggregators simplify the experience for less technical users but still require understanding of risks such as impermanent loss and smart contract vulnerabilities. Competition among aggregators has led to innovations like gas fee optimization and multi-chain integration.
In Brazil, yield aggregator usage grows alongside cryptocurrency adoption, though volatility and regulation remain challenges. Tools like Zapper and Zerion also offer unified portfolio dashboards, combining yield farming with other DeFi assets.
Frequently Asked Questions
What is a yield aggregator?
It is a platform that automatically searches for the best returns across DeFi protocols, displaying them on a dashboard so users can compare and deposit assets optimally.
What risks are involved in using yield aggregators?
Main risks include impermanent loss, smart contract vulnerabilities, asset volatility, and high gas fees. It is important to research the aggregator's security before using.
How is APY calculated on these dashboards?
APY is calculated based on current interest rates from protocols, considering the automatic compounding offered by some aggregators. The displayed value is an annualized projection and may change in real time.
Direct URL
https://pub-c7d6a6ea828543ac903a74a341ccb2e1.r2.dev/imagens/defi-yield-aggregator-dashboard-showing-apy-rates-across-protocols-cinematic-wide-shot-twilight-blue-hour.avifHow to credit
Include a visible link back to UtilizAí. Copy one of the snippets below:
<a href="https://xn--utiliza-eza.com/en/midia/imagens/defi-yield-aggregator-dashboard-showing-apy-rates-across-protocols-cinematic-wide-shot-twilight-blue-hour">DeFi yield aggregator dashboard showing APY rates across protocols</a> by <a href="https://xn--utiliza-eza.com">UtilizAí</a>, licensed under <a href="https://creativecommons.org/licenses/by/4.0/">CC BY 4.0</a>.
[DeFi yield aggregator dashboard showing APY rates across protocols](https://xn--utiliza-eza.com/en/midia/imagens/defi-yield-aggregator-dashboard-showing-apy-rates-across-protocols-cinematic-wide-shot-twilight-blue-hour) by [UtilizAí](https://xn--utiliza-eza.com), CC BY 4.0
License: CC-BY-4.0
Tags
Related images
 Stablecoin minting interface showing collateralization ratio
 Stablecoin minting interface showing collateralization ratio
 Stablecoin minting interface showing collateralization ratio
 Stablecoin minting interface showing collateralization ratio
 Stablecoin minting interface showing collateralization ratio
 Stablecoin minting interface showing collateralization ratio