Blockchain network visualization 3D nodes
1344×768 · AVIF · CC BY 4.0
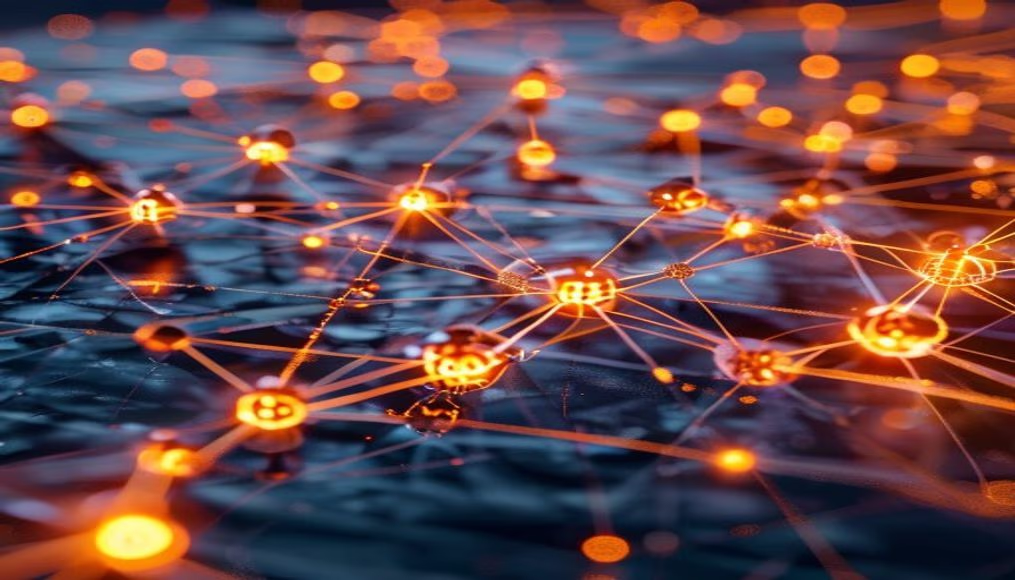
Blockchain is a decentralized network of nodes that validate and record transactions. 3D visualizations help understand its complex topology.
About this subject
A blockchain is a distributed ledger maintained by a network of nodes, which are computers running the protocol software. Each node keeps a full or partial copy of the transaction history. In Bitcoin, for example, thousands of nodes worldwide ensure no single entity controls the network.
Nodes can be categorized as full nodes, which validate all transactions and blocks, and light nodes, which rely on others for verification. 3D visualization of these networks reveals geographic distribution, connectivity, and system resilience. Tools like Bitnodes and interactive maps display node locations in real time.
The topology of a blockchain network is dynamic: nodes join and leave constantly. Academic studies use 3D visualizations to analyze attacks, such as Sybil attacks, and to understand information propagation. Three-dimensional representations make it easier to identify clusters and communication patterns, essential for network security.
Proof-of-work blockchains like Bitcoin consume significant energy, but visualizing nodes helps optimize efficiency. Other blockchains like Ethereum (before the shift to proof-of-stake) also rely on extensive node networks. Visual comprehension of the structure is crucial for developers and researchers aiming to improve scalability and decentralization.
Frequently Asked Questions
What is a node in a blockchain?
A node is any computer connected to the blockchain network that maintains a copy of the ledger and participates in validating and propagating transactions. There are full nodes and light nodes.
How many nodes are there in the Bitcoin network?
The number varies, but as of 2025 there were about 15,000 to 20,000 reachable nodes. Many nodes are not public (e.g., behind firewalls), so the actual total is higher.
Why is 3D visualization of blockchain networks useful?
3D visualization helps identify connectivity patterns, geographic distribution, and potential vulnerabilities. It is used in research to improve network security, resilience, and decentralization.
Direct URL
https://pub-c7d6a6ea828543ac903a74a341ccb2e1.r2.dev/imagens/blockchain-network-visualization-3d-nodes-travel-photography-v10.avifHow to credit
Include a visible link back to UtilizAí. Copy one of the snippets below:
<a href="https://xn--utiliza-eza.com/en/midia/imagens/blockchain-network-visualization-3d-nodes-travel-photography-v10">Blockchain network visualization 3D nodes</a> by <a href="https://xn--utiliza-eza.com">UtilizAí</a>, licensed under <a href="https://creativecommons.org/licenses/by/4.0/">CC BY 4.0</a>.
[Blockchain network visualization 3D nodes](https://xn--utiliza-eza.com/en/midia/imagens/blockchain-network-visualization-3d-nodes-travel-photography-v10) by [UtilizAí](https://xn--utiliza-eza.com), CC BY 4.0
License: CC-BY-4.0