Oscilloscope display waveform
1344×768 · AVIF · CC BY 4.0
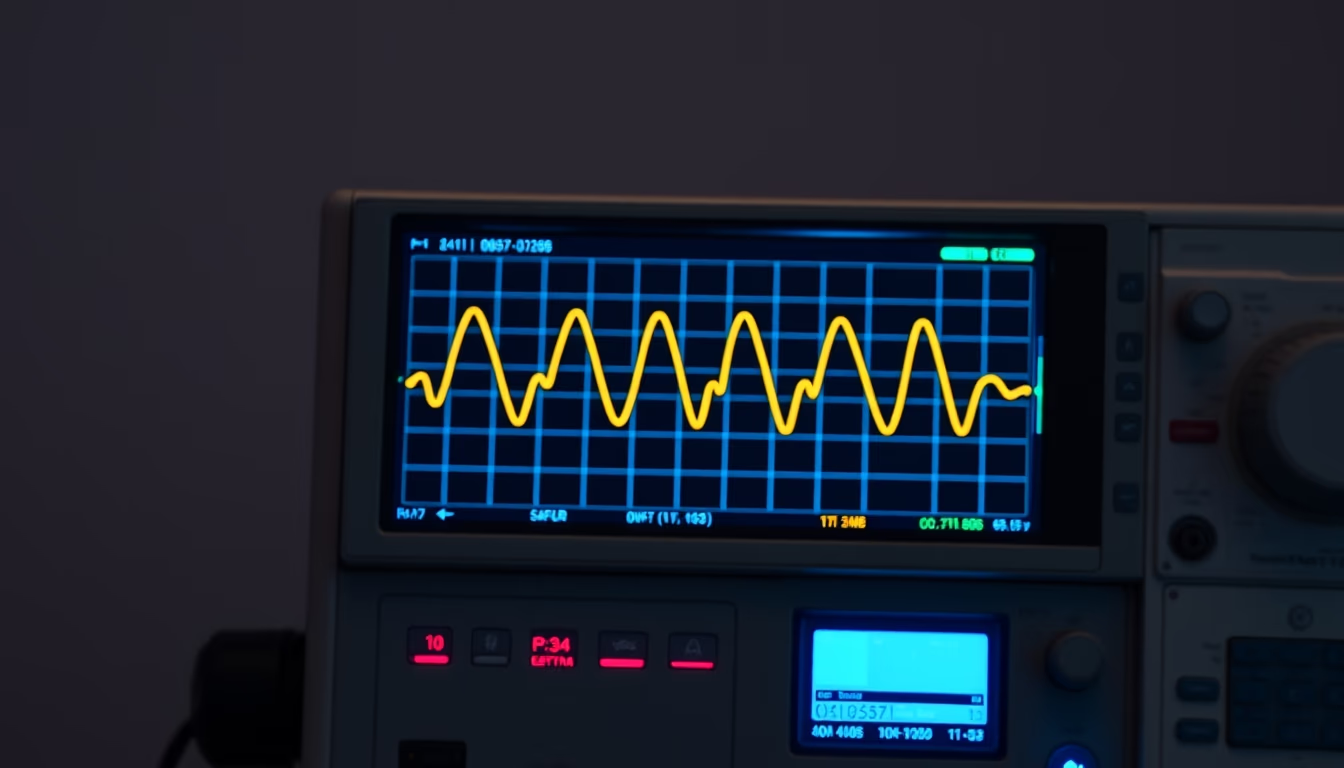
Oscilloscope displays electrical waveform, an essential tool for signal analysis in electronics and engineering.
About this subject
An oscilloscope is an electronic test instrument that displays the variation of voltage of an electrical signal over time on a screen. The waveform reveals characteristics such as amplitude, frequency, period, distortion, and noise. Two main types exist: analog oscilloscopes, which use a cathode ray tube (CRT) to deflect an electron beam, and digital storage oscilloscopes (DSOs), which sample the signal and store it digitally, offering advanced triggering and mathematical analysis.
The operating principle traces back to German physicist Ferdinand Braun, who developed the cathode ray tube in 1897. During World War II, oscilloscopes were crucial for radar and communications development. Today, digital models have bandwidths exceeding tens of GHz and can capture high-frequency signals in real time. The timebase controls the speed at which the trace moves across the screen, allowing observation of slow or extremely fast phenomena.
In practice, engineers and technicians use oscilloscopes for circuit debugging, audio analysis, testing switched-mode power supplies, decoding serial protocols (I2C, SPI, UART), and measuring jitter. Correct waveform interpretation helps identify issues such as shorts, unwanted capacitance, or electromagnetic interference. Many modern oscilloscopes also include built-in function generators and FFT analysis, turning them into versatile lab workstations.
Frequently Asked Questions
What is the difference between analog and digital oscilloscopes?
Analog oscilloscopes use a CRT to display signals in real time, best for repetitive signals. Digital oscilloscopes sample and store signals, allowing visualization of single-shot events, precise measurements, and features like FFT analysis.
What is bandwidth in an oscilloscope?
Bandwidth is the frequency range over which the instrument can measure accurately (within 3 dB attenuation). For digital signals, a bandwidth at least 5 times the signal frequency is recommended to avoid distortion.
How do you interpret a waveform on an oscilloscope?
Check amplitude (volts/div), period (time/div), shape (sine, square, pulses), and distortion. Trigger stabilizes the image by setting the starting point, useful for analyzing transients or specific patterns.
Direct URL
https://pub-c7d6a6ea828543ac903a74a341ccb2e1.r2.dev/imagens/oscilloscope-display-waveform-studio-editorial-portrait-p9.avifHow to credit
Include a visible link back to UtilizAí. Copy one of the snippets below:
<a href="https://xn--utiliza-eza.com/en/midia/imagens/oscilloscope-display-waveform-studio-editorial-portrait-p9">Oscilloscope display waveform</a> by <a href="https://xn--utiliza-eza.com">UtilizAí</a>, licensed under <a href="https://creativecommons.org/licenses/by/4.0/">CC BY 4.0</a>.
[Oscilloscope display waveform](https://xn--utiliza-eza.com/en/midia/imagens/oscilloscope-display-waveform-studio-editorial-portrait-p9) by [UtilizAí](https://xn--utiliza-eza.com), CC BY 4.0
License: CC-BY-4.0