Oscilloscope display waveform
1344×768 · AVIF · CC BY 4.0
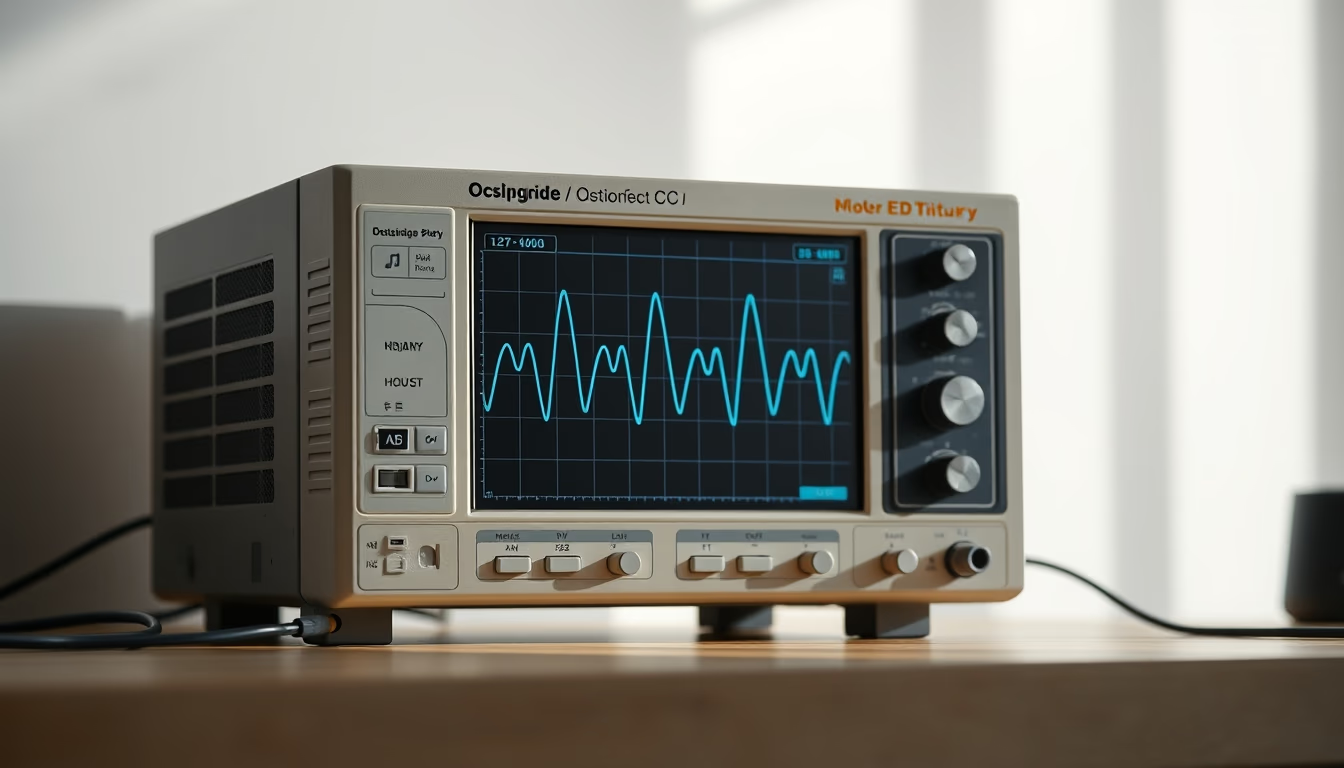
An oscilloscope is an essential instrument in electronics for visualizing electrical signals, displaying waveforms that reveal voltage over time.
About this subject
The oscilloscope is a fundamental tool for engineers and technicians in electronics, enabling the observation of varying electrical signals. Its primary function is to display a waveform, representing signal voltage over time. This visualization is crucial for diagnosing circuit problems, measuring frequencies, amplitudes, and distortions, as well as analyzing the timing of digital pulses.
Early oscilloscopes, developed in the 1930s, used cathode-ray tubes (CRTs) to draw waveforms. With technological advances, modern models are digital, offering higher precision, data storage, and interfaces like USB and Ethernet. Digital oscilloscopes can capture fast events with sampling rates in the gigasamples per second range.
Common waveforms include sine waves (standard AC), square waves (digital signals), triangle waves, and sawtooth waves. Each type provides specific information: sine waves indicate frequency and amplitude, square waves reveal rise and fall times, essential for assessing signal integrity in digital systems. Waveform analysis is applied in fields such as telecommunications, audio, medicine (electrocardiograms), and scientific research.
In Brazil, oscilloscopes are widely used in university laboratories, electronics industries, and repair shops. Brands like Tektronix, Keysight, and Rigol dominate the market. Basic knowledge of waveform interpretation is indispensable for any electronics professional.
Frequently Asked Questions
What is an oscilloscope used for?
An oscilloscope is used to visualize and measure varying electrical signals by displaying their waveform. It helps diagnose circuits, measure frequency, amplitude, distortion, and signal timing.
What is the difference between analog and digital oscilloscopes?
Analog oscilloscopes use a cathode-ray tube to display the signal in real time without storage. Digital oscilloscopes convert the signal to digital, allowing storage, mathematical analysis, and higher precision.
How to interpret waveforms on an oscilloscope?
Each waveform provides specific information. Sine waves show frequency and amplitude; square waves indicate logic transitions; triangle waves reveal linearity. Analysis involves measuring period, amplitude, rise time, etc.
Direct URL
https://pub-c7d6a6ea828543ac903a74a341ccb2e1.r2.dev/imagens/oscilloscope-display-waveform-minimalist-composition-p12.avifHow to credit
Include a visible link back to UtilizAí. Copy one of the snippets below:
<a href="https://xn--utiliza-eza.com/en/midia/imagens/oscilloscope-display-waveform-minimalist-composition-p12">Oscilloscope display waveform</a> by <a href="https://xn--utiliza-eza.com">UtilizAí</a>, licensed under <a href="https://creativecommons.org/licenses/by/4.0/">CC BY 4.0</a>.
[Oscilloscope display waveform](https://xn--utiliza-eza.com/en/midia/imagens/oscilloscope-display-waveform-minimalist-composition-p12) by [UtilizAí](https://xn--utiliza-eza.com), CC BY 4.0
License: CC-BY-4.0