Oscilloscope display waveform
1344×768 · AVIF · CC BY 4.0
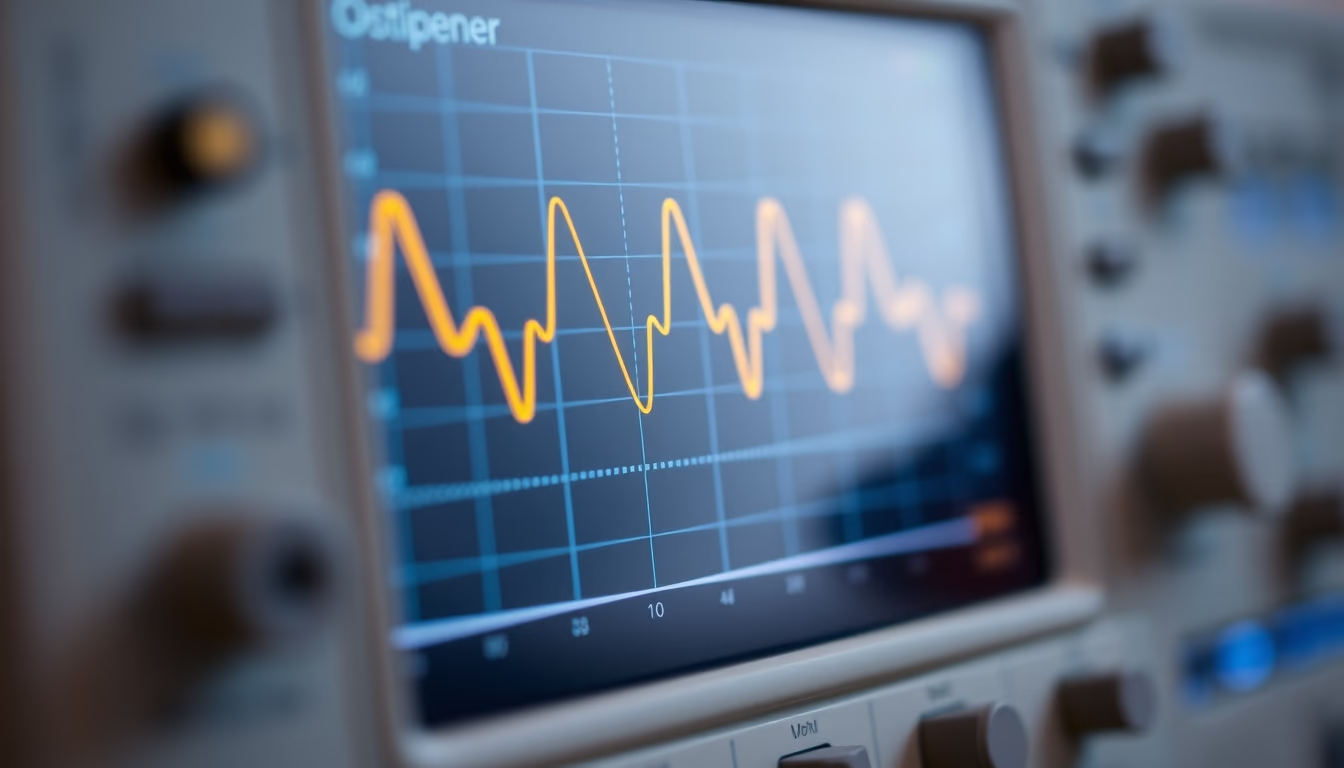
Oscilloscope displays a waveform in macro closeup, revealing amplitude and frequency details of an electrical signal.
About this subject
An oscilloscope is an electronic test instrument that displays varying signal voltages over time on a screen. It plots voltage on the vertical axis (amplitude) against time on the horizontal axis, forming a characteristic waveform. This macro closeup image highlights the measurement grid and signal curve, emphasizing voltage peaks and period.
The displayed waveform can take various forms depending on the signal source: sinusoidal for alternating current, square for digital signals, sawtooth for sweeps, among others. The oscilloscope allows adjustment of time and amplitude scales via controls like time/div and volts/div, enabling precise analysis of parameters such as frequency, duty cycle, and waveform shape. Modern models include trigger features to stabilize the image for repetitive events.
This instrument is essential in electronics labs, equipment maintenance, and circuit development. Engineers and technicians use it for fault diagnosis, signal integrity verification, and distortion measurement. Analog oscilloscopes, like the one in the image, use cathode-ray tubes to generate the display, while digital versions offer data storage and advanced analysis. Bandwidth, measured in megahertz, determines the instrument's ability to capture high-frequency signals without attenuation.
Notably, the first oscilloscope was developed in the late 19th century by Karl Ferdinand Braun, precursor to the cathode-ray tube. It has since become an indispensable tool. In the image, the sharp trace and grid brightness suggest fine adjustment of focus and intensity, typical of professional equipment.
Frequently Asked Questions
What is the difference between analog and digital oscilloscopes?
Analog oscilloscopes use a cathode-ray tube to draw the waveform in real time, while digital oscilloscopes sample the signal, convert it to digital data, and display it. Digital oscilloscopes allow storage, zoom, and analysis of random events.
How to measure the frequency of a signal with an oscilloscope?
Adjust the time base so that one complete cycle occupies several divisions on the screen. Multiply the number of divisions by the time/div setting to get the period in seconds. Frequency is the inverse of period: f = 1/T.
What is the trigger function on an oscilloscope?
Trigger stabilizes the display by synchronizing the sweep with a specific point in the signal, such as a voltage level. This allows consistent viewing of repetitive waveforms and reliable measurements.
Direct URL
https://pub-c7d6a6ea828543ac903a74a341ccb2e1.r2.dev/imagens/oscilloscope-display-waveform-macro-closeup-p11.avifHow to credit
Include a visible link back to UtilizAí. Copy one of the snippets below:
<a href="https://xn--utiliza-eza.com/en/midia/imagens/oscilloscope-display-waveform-macro-closeup-p11">Oscilloscope display waveform</a> by <a href="https://xn--utiliza-eza.com">UtilizAí</a>, licensed under <a href="https://creativecommons.org/licenses/by/4.0/">CC BY 4.0</a>.
[Oscilloscope display waveform](https://xn--utiliza-eza.com/en/midia/imagens/oscilloscope-display-waveform-macro-closeup-p11) by [UtilizAí](https://xn--utiliza-eza.com), CC BY 4.0
License: CC-BY-4.0