Ethereum gas fees dashboard chart
1344×768 · AVIF · CC BY 4.0
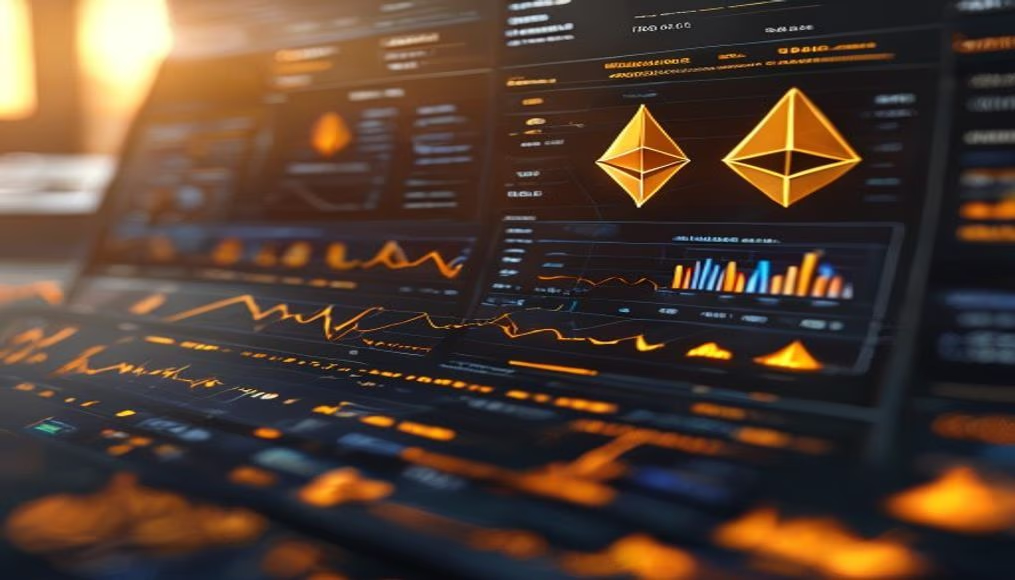
Ethereum gas fees dashboard chart: understand how transaction costs work on the network and how to monitor them in real time.
About this subject
Ethereum gas fees represent the computational cost required to execute transactions or smart contracts on the blockchain. Each operation, such as sending ETH or interacting with a DeFi protocol, consumes a certain amount of gas measured in units. The gas price is denominated in gwei (1 gwei = 10⁻⁹ ETH) and fluctuates with network demand. When many users compete for block space, fees rise; during low activity periods, they drop.
Dashboards like Etherscan or on-chain analytics platforms display historical and real-time gas fee charts. These panels show average, low, and high gas (priority fee), as well as the base fee (EIP-1559). Since the London upgrade in August 2021, a portion of gas is burned, reducing ETH supply and creating a deflationary effect during high activity.
For everyday users, understanding the dashboard helps choose the best time to transact, saving on fees. Developers optimize contracts to consume less gas. Fee volatility has spurred solutions like rollups (Optimism, Arbitrum) and the migration to Ethereum 2.0 (proof-of-stake), which promises greater scalability. In 2023, average gas briefly exceeded 100 gwei during NFT and DeFi peaks, while on weekends it can fall below 20 gwei.
Frequently Asked Questions
What is gas on Ethereum?
Gas is a unit that measures the computational effort required to execute operations on the Ethereum network. Each transaction or smart contract interaction consumes a certain amount of gas, paid in ETH (converted to gwei).
How can I check gas fees in real time?
You can use websites like Etherscan (Gas Tracker section), ETH Gas Station, or wallet interfaces such as MetaMask, which display cost estimates based on current network congestion.
Why do gas fees fluctuate so much?
Fluctuations occur due to supply and demand for block space. When many users try to transact simultaneously, fees spike. Popular events (NFT drops, DeFi) and peak hours drive up costs.
Direct URL
https://pub-c7d6a6ea828543ac903a74a341ccb2e1.r2.dev/imagens/ethereum-gas-fees-dashboard-chart-travel-photography-v10.avifHow to credit
Include a visible link back to UtilizAí. Copy one of the snippets below:
<a href="https://xn--utiliza-eza.com/en/midia/imagens/ethereum-gas-fees-dashboard-chart-travel-photography-v10">Ethereum gas fees dashboard chart</a> by <a href="https://xn--utiliza-eza.com">UtilizAí</a>, licensed under <a href="https://creativecommons.org/licenses/by/4.0/">CC BY 4.0</a>.
[Ethereum gas fees dashboard chart](https://xn--utiliza-eza.com/en/midia/imagens/ethereum-gas-fees-dashboard-chart-travel-photography-v10) by [UtilizAí](https://xn--utiliza-eza.com), CC BY 4.0
License: CC-BY-4.0