Ethereum gas fees dashboard chart
1344×768 · AVIF · CC BY 4.0
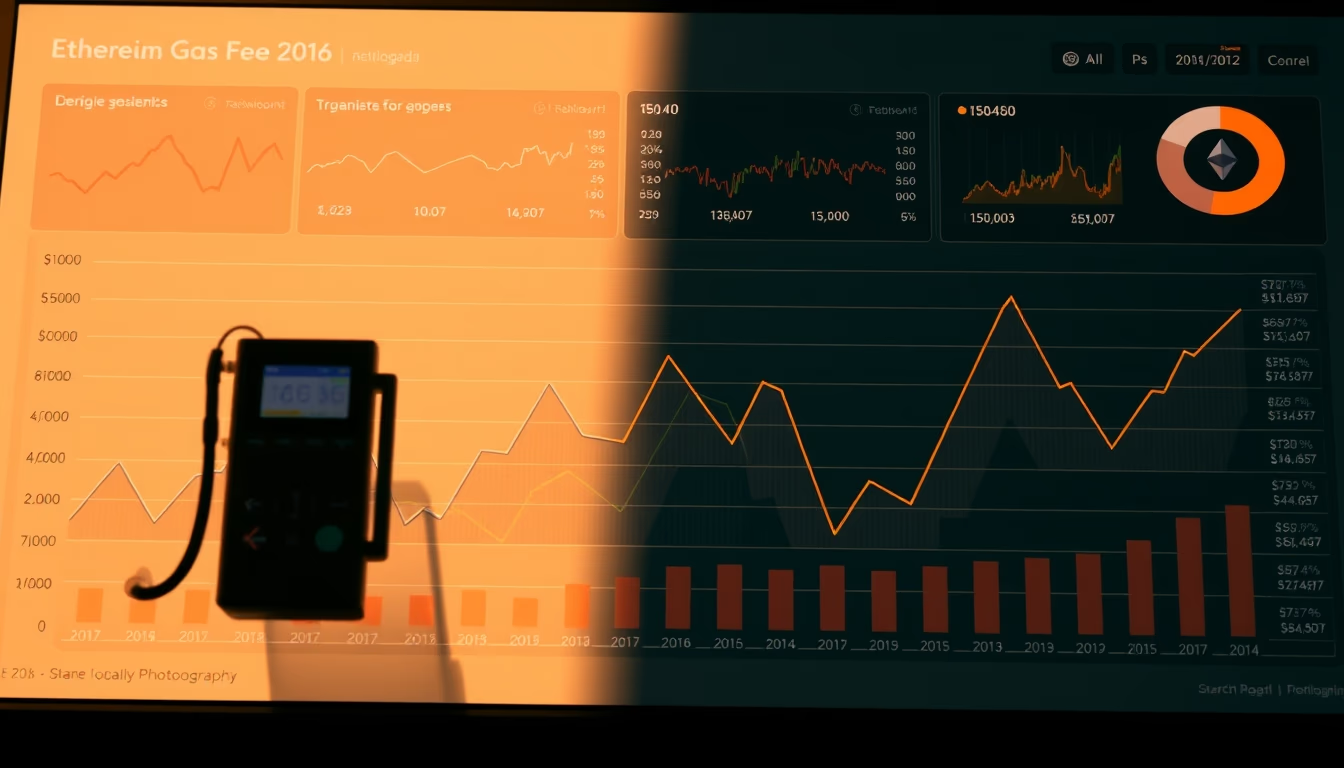
Dashboard displaying Ethereum gas fee history, essential for understanding transaction costs on the blockchain.
About this subject
The Ethereum gas fees dashboard is a critical tool for users and developers to track transaction costs on the second-largest blockchain. Gas fees, paid in ETH, vary with network demand: the more congested, the higher the price for fast confirmation. Historically, spikes occurred during events like the 2021 NFT boom and popular contract launches, reaching hundreds of dollars per simple transaction.
The most common metric is the average gas price in Gwei (1 Gwei = 10⁻⁹ ETH). The dashboard typically displays candlestick or line charts showing lows, highs, and averages over periods like 1 hour, 24 hours, or 7 days. Platforms such as Etherscan, GasNow, and Dune Analytics provide these panels, enabling traders and developers to choose the optimal time to execute transactions and save on fees.
Furthermore, Ethereum's transition to Proof of Stake (The Merge) in September 2022 altered fee dynamics, but the gas mechanism remains. The EIP-1559 upgrade in August 2021 introduced a burned base fee and optional tips, making costs more predictable. However, during high activity, such as airdrops or token sales, fees can still surge, making the dashboard essential to avoid surprises.
Frequently Asked Questions
What does Gwei mean in the context of Ethereum?
Gwei is a unit of ether (ETH), where 1 Gwei equals 10⁻⁹ ETH. It is used to express the gas price, the fee paid to process transactions on the Ethereum network.
How did EIP-1559 affect gas fees?
EIP-1559, implemented in August 2021, introduced a burned base fee and an optional tip for validators. This made fees more predictable but did not eliminate spikes during congestion.
Where can I check the historical gas fees of Ethereum?
Websites like Etherscan, GasNow, and Dune Analytics offer dashboards with historical gas fee charts, allowing filtering by time periods and viewing trends.
Direct URL
https://pub-c7d6a6ea828543ac903a74a341ccb2e1.r2.dev/imagens/ethereum-gas-fees-dashboard-chart-fine-art-photography.avifHow to credit
Include a visible link back to UtilizAí. Copy one of the snippets below:
<a href="https://xn--utiliza-eza.com/en/midia/imagens/ethereum-gas-fees-dashboard-chart-fine-art-photography">Ethereum gas fees dashboard chart</a> by <a href="https://xn--utiliza-eza.com">UtilizAí</a>, licensed under <a href="https://creativecommons.org/licenses/by/4.0/">CC BY 4.0</a>.
[Ethereum gas fees dashboard chart](https://xn--utiliza-eza.com/en/midia/imagens/ethereum-gas-fees-dashboard-chart-fine-art-photography) by [UtilizAí](https://xn--utiliza-eza.com), CC BY 4.0
License: CC-BY-4.0