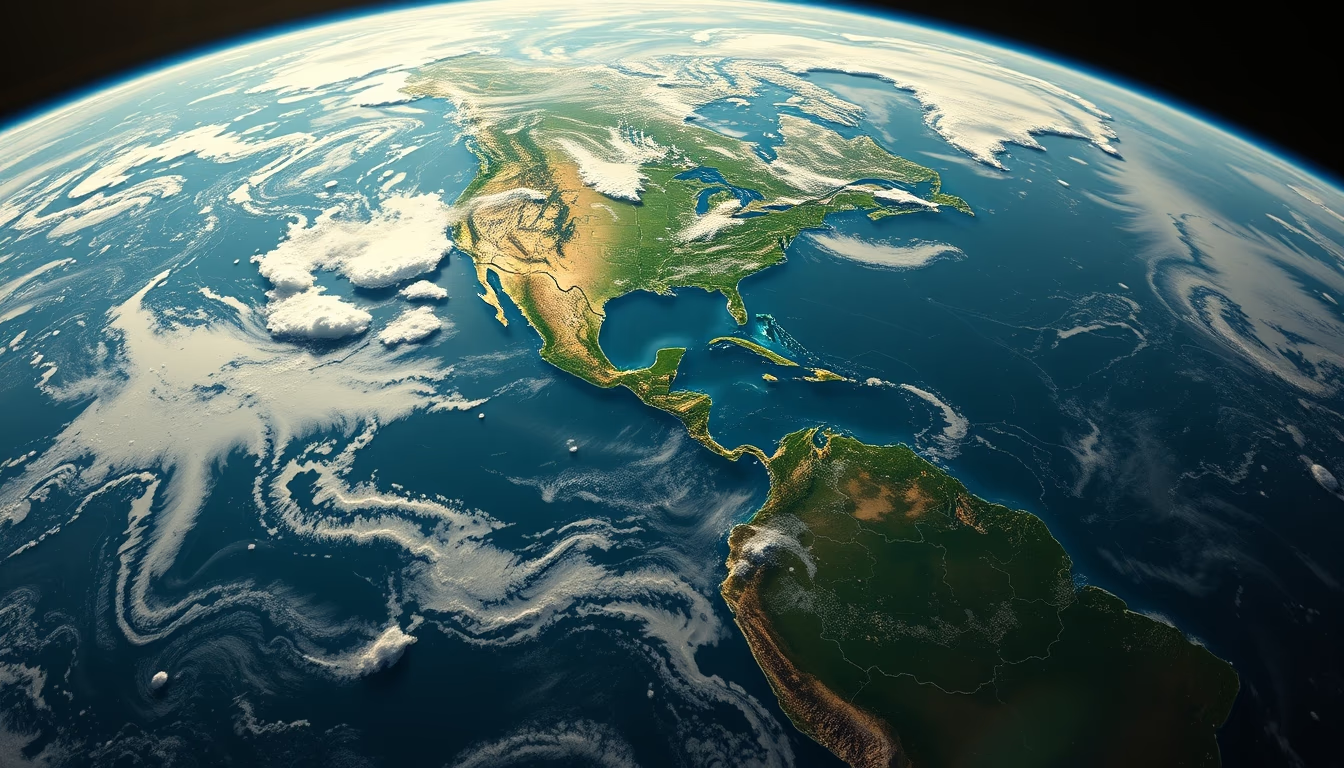
Urban heat island map
1344×768 · AVIF · CC BY 4.0

Urban heat island map shows temperature differences between urban and rural areas, mapped by satellites for climate planning.
About this subject
Urban heat islands (UHIs) are climatic phenomena where metropolitan areas experience significantly higher temperatures than surrounding rural regions. This effect arises from replacing natural surfaces with materials like asphalt and concrete, which absorb and retain heat, plus human activities (vehicles, industries) that release additional heat. Satellites such as NASA's MODIS and Landsat, and ESA's Sentinel-3, monitor land surface temperature globally, generating detailed UHI maps. Thermal satellite data pinpoint the most critical hotspots within cities, such as densely built centers or areas with sparse vegetation.
In Brazil, UHI mapping studies are conducted in metropolises like São Paulo, Rio de Janeiro, and Belo Horizonte. In São Paulo, for example, the temperature difference between the downtown and peripheral green areas can reach 10°C on summer days. These maps are essential for mitigation policies, such as creating green corridors, reflective roofs, and promoting tree planting. Besides satellites, ground weather stations complement data, but orbital views offer continuous spatial coverage.
Interesting fact: coastal cities or those with many parks tend to have milder UHIs. The heat island effect persists at night; slow release of stored heat keeps urban areas warmer, affecting thermal comfort and increasing energy demand for cooling. Organizations like the World Meteorological Organization (WMO) encourage using satellite data for sustainable urban planning.
Frequently Asked Questions
What causes an urban heat island?
Replacing natural surfaces with heat-retaining materials (asphalt, concrete) and human activities (traffic, industry) raise local temperatures. Lack of vegetation and urban geometry that hinders ventilation also contribute.
How do satellites map heat islands?
Satellites with thermal infrared sensors, like MODIS and Landsat, measure emitted surface radiation. Data is processed into land surface temperature maps, highlighting the hottest areas within cities.
What solutions help reduce the effect?
Increasing green spaces, installing green or reflective roofs, using permeable pavements, and creating wind corridors. Urban planning policies based on heat island maps are effective.
Direct URL
https://pub-c7d6a6ea828543ac903a74a341ccb2e1.r2.dev/imagens/urban-heat-island-map-studio-editorial-portrait-fresh16.avifHow to credit
Include a visible link back to UtilizAí. Copy one of the snippets below:
<a href="https://xn--utiliza-eza.com/en/midia/imagens/urban-heat-island-map-studio-editorial-portrait-fresh16">Urban heat island map</a> by <a href="https://xn--utiliza-eza.com">UtilizAí</a>, licensed under <a href="https://creativecommons.org/licenses/by/4.0/">CC BY 4.0</a>.
[Urban heat island map](https://xn--utiliza-eza.com/en/midia/imagens/urban-heat-island-map-studio-editorial-portrait-fresh16) by [UtilizAí](https://xn--utiliza-eza.com), CC BY 4.0
License: CC-BY-4.0