Urban heat island map
1344×768 · AVIF · CC BY 4.0

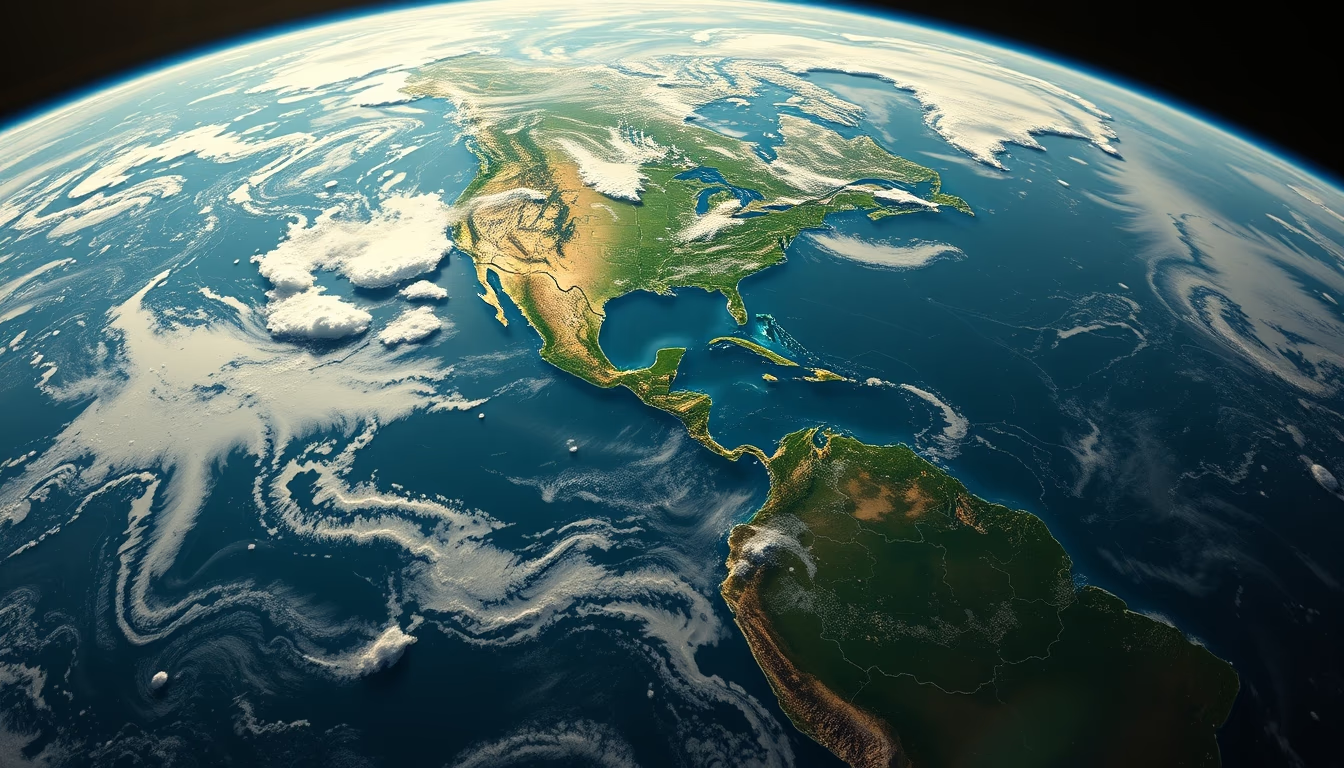
Satellite-derived urban heat island maps reveal temperature differences between urban and rural areas, aiding city climate planning.
About this subject
Urban heat islands are phenomena where metropolitan areas experience significantly higher temperatures than surrounding rural regions. This effect results from replacing natural surfaces with concrete, asphalt, and buildings that absorb and retain heat. Satellites equipped with thermal sensors, such as MODIS (Moderate Resolution Imaging Spectroradiometer) aboard NASA's Terra and Aqua satellites, enable mapping these differences at resolutions down to 1 km. These maps are crucial for identifying heat hotspots, guiding urban tree planting policies, and reflecting on cooler construction materials. In Brazil, cities like São Paulo and Rio de Janeiro already use such data to mitigate heatwave impacts, which have intensified with climate change. Studies show temperature differences can reach 10°C in large urban centers, affecting public health, energy consumption, and air quality. Time-series analysis of these maps helps monitor the effectiveness of measures like green roofs and permeable pavements.
Frequently Asked Questions
What causes urban heat islands?
The replacement of natural surfaces with materials like concrete and asphalt, which absorb and retain heat, along with reduced green spaces and heat emissions from vehicles and cooling systems, intensifies local warming.
How do satellites measure urban heat islands?
Satellites with thermal infrared sensors, such as MODIS, capture surface-emitted radiation. The data is processed to produce land surface temperature maps, highlighting hotter areas within cities.
What is the typical temperature difference between urban centers and rural areas?
It can range from 1°C to 10°C, depending on city size, building density, and vegetation. Large metropolises like São Paulo register differences of up to 8°C.
Direct URL
https://pub-c7d6a6ea828543ac903a74a341ccb2e1.r2.dev/imagens/urban-heat-island-map-long-exposure-fresh9.avifHow to credit
Include a visible link back to UtilizAí. Copy one of the snippets below:
<a href="https://xn--utiliza-eza.com/en/midia/imagens/urban-heat-island-map-long-exposure-fresh9">Urban heat island map</a> by <a href="https://xn--utiliza-eza.com">UtilizAí</a>, licensed under <a href="https://creativecommons.org/licenses/by/4.0/">CC BY 4.0</a>.
[Urban heat island map](https://xn--utiliza-eza.com/en/midia/imagens/urban-heat-island-map-long-exposure-fresh9) by [UtilizAí](https://xn--utiliza-eza.com), CC BY 4.0
License: CC-BY-4.0