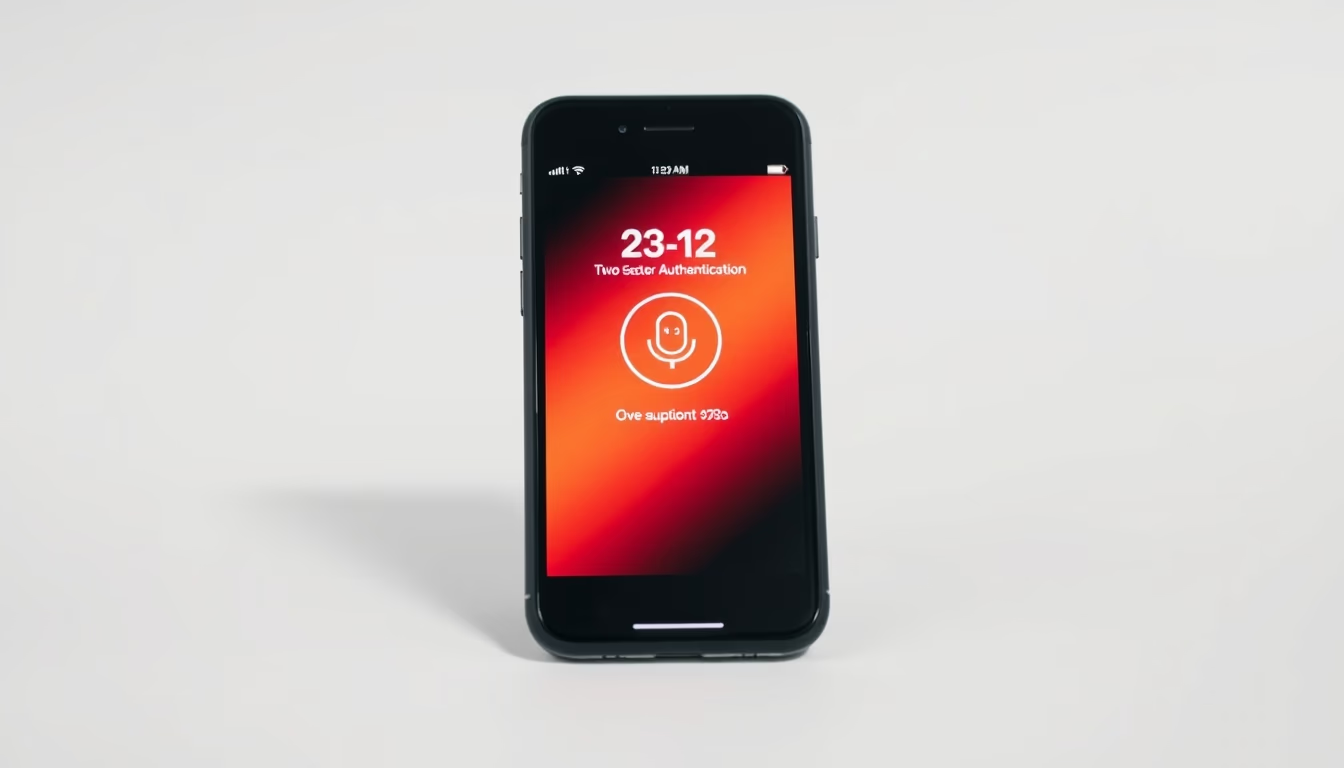
Cyber attack visualization
1344×768 · AVIF · CC BY 4.0

Cyber attack visualization: graphical representations that help analysts identify patterns and respond to threats in real time.
About this subject
Cyber attack visualization transforms raw data from network logs, traffic, and security events into easy-to-understand graphs, maps, and diagrams. These representations help security teams detect anomalies such as sudden traffic spikes or suspicious connections that may indicate ongoing intrusions. Tools like IP relationship graphs or login attempt heatmaps are common examples used in Security Operations Centers (SOCs).
The importance of this technique has grown with the increasing sophistication of cyberattacks. According to the IBM Cost of a Data Breach 2023 report, the average time to identify a breach is 207 days. Effective visualizations can reduce this time by highlighting hidden patterns that would go unnoticed in tables of numbers. Additionally, real-time maps of attack origins, such as those displayed in security company dashboards, help contextualize threats globally.
In Brazil, cyber attack visualization gained relevance with the advancement of the Internet Civil Rights Framework and the General Data Protection Law (LGPD). Companies in sectors like finance and healthcare use these tools to monitor unauthorized access and ensure regulatory compliance. Events like the attack on the STJ (Superior Court of Justice) system in 2020 highlighted the need for quick responses, where data visualization played a crucial role in damage containment.
Interestingly, the aesthetics of visualizations also influence credibility. Images with film grain or authentic textures can be used in presentations to convey a sense of constant vigilance, but the underlying technical content remains the same: turning bits into actionable insights to protect networks and data.
Frequently Asked Questions
What is cyber attack visualization?
It is the use of graphs, maps, and diagrams to represent security data, enabling faster identification of attack patterns and threat response in a more intuitive way.
Which tools are used to visualize attacks?
Tools like Grafana, Kibana (ELK Stack), Splunk, and specialized software such as Wireshark for traffic analysis generate real-time visualizations of logs and security events.
How does visualization help in attack prevention?
By highlighting behavioral anomalies, such as logins at unusual hours or connections to known malicious IPs, visualization allows analysts to take corrective actions before damage occurs.
Direct URL
https://pub-c7d6a6ea828543ac903a74a341ccb2e1.r2.dev/imagens/cyber-attack-visualization-film-grain-authentic-p6.avifHow to credit
Include a visible link back to UtilizAí. Copy one of the snippets below:
<a href="https://xn--utiliza-eza.com/en/midia/imagens/cyber-attack-visualization-film-grain-authentic-p6">Cyber attack visualization</a> by <a href="https://xn--utiliza-eza.com">UtilizAí</a>, licensed under <a href="https://creativecommons.org/licenses/by/4.0/">CC BY 4.0</a>.
[Cyber attack visualization](https://xn--utiliza-eza.com/en/midia/imagens/cyber-attack-visualization-film-grain-authentic-p6) by [UtilizAí](https://xn--utiliza-eza.com), CC BY 4.0
License: CC-BY-4.0